According to Statista, in 2025, the projected volume of the Asian pharmaceutical market will reach 248.8 billion USD. Among the key factors contributing to the industry’s growth are an aging population, which increases the need for chronic disease treatment, as well as a growing middle class and rising disposable income, which stimulate spending on medicinal products and health maintenance products.
Central Asia, including Uzbekistan, holds an important place in the structure of the regional pharmaceutical market. The steady interest from international manufacturers is a direct reflection of the growth in pharma sales in the country.
This publication presents an overview of the key indicators and trends of the retail pharmaceutical market in the Republic of Uzbekistan (covering the sales of drugs and dietary supplements in Uzbekistan) for Q1 2025, with a focus on potential growth points and areas of concern.
The material was prepared using data from the market research analytical system “PharmXplorer” by “Proxima Research International”.
In Q1 2025, the retail pharmaceutical market of Uzbekistan in monetary terms amounted to 520 million USD. In physical terms, the sales volume of drugs and dietary supplements in Uzbekistan for Q1 2025 is estimated at 151 million packages. Compared to the neighboring state, the Republic of Kazakhstan, these figures are higher by 26% in dollars and 11.9% in packages. This may be due to the fact that although the territory of Uzbekistan is smaller, its population is larger (Fig. 1).
Fig. 1. Volume of the retail pharmaceutical market of the Republic of Uzbekistan in comparison with the Republic of Kazakhstan in Q1 2025.
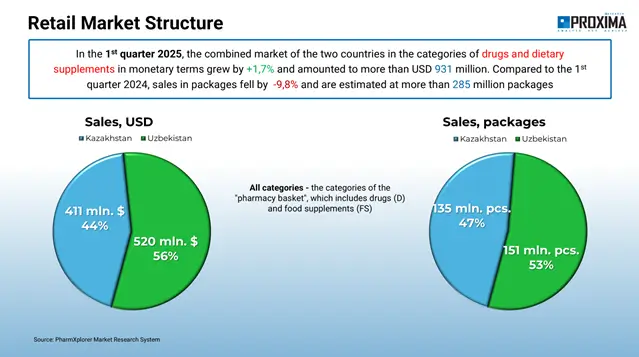
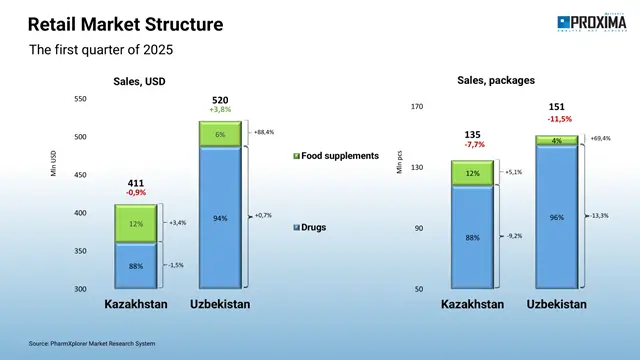
Compared to the same period of the previous year, the sales volume of medicinal products and dietary supplements in Uzbekistan increased by 3.8% in monetary terms, but a decline of 11.5% was noted in physical terms. The main contribution to consumption is provided by medicinal products – over 90% in both monetary and physical terms, while the share of dietary supplements is less than 10% respectively.
A similar structure is characteristic of the neighboring market of the Republic of Kazakhstan (Fig. 2).
Fig. 2. Structure and volume of the retail pharmaceutical market of the Republic of Uzbekistan in Q1 2025 in comparison with the Republic of Kazakhstan
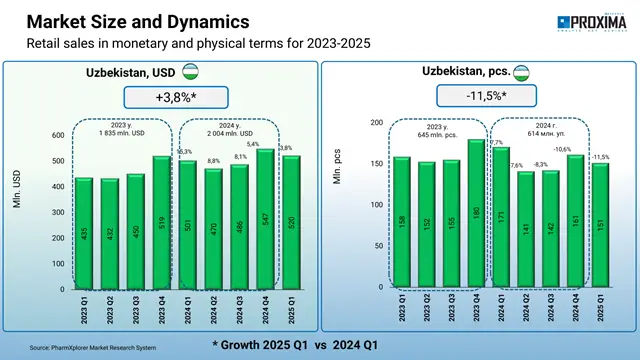
In the previous periods of 2023–2024, the pharmaceutical market of Uzbekistan showed active growth in monetary terms, but a slowdown is noted in the period under review. At the same time, a steady downward trend in consumption is observed in physical terms (Fig. 3).
Fig. 3. Dynamics of the retail pharmaceutical market of the Republic of Uzbekistan from Q1 2023 to Q1 2025.
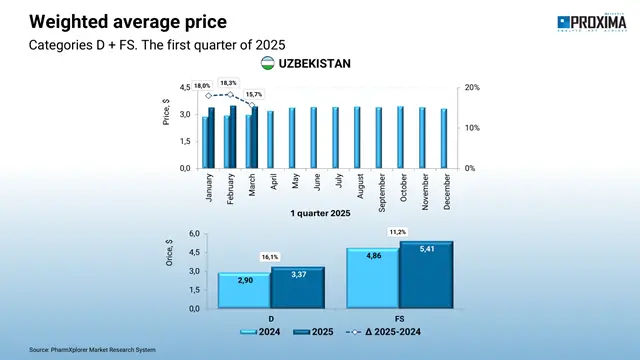
The weighted average retail price of one package consistently shows double-digit growth in both categories (Fig. 4).
Fig. 4. Dynamics of the weighted average price of one package in the pharmaceutical market of the Republic of Uzbekistan from 2024 to Q1 2025.
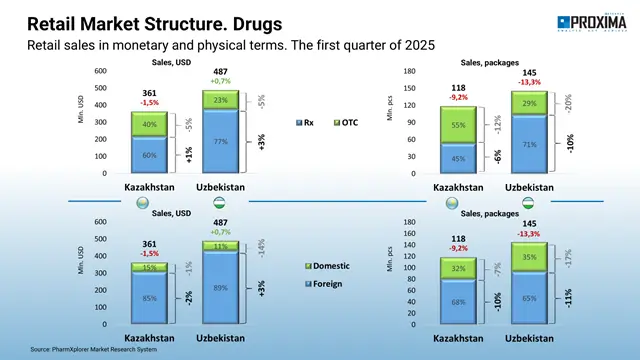
The main share of medicinal product sales in Uzbekistan’s pharmacies is attributed to prescription drugs. Its structure is similar to the situation in Kazakhstan, but in the neighboring country, the distribution is more even. It is also worth noting that the pharmaceutical market of Uzbekistan is significantly import-dependent (as in Kazakhstan), with the prevalence of imported drugs at 89% in monetary terms and 65% in physical equivalent. Thus, although domestic products account for a third of sales in packages, this is only 11% in monetary terms (Fig. 5).
Fig. 5. Structure of the retail pharmaceutical market of the Republic of Uzbekistan in Q1 2025 by prescription status, as well as domestic and foreign manufacturers, and comparison with the Republic of Kazakhstan
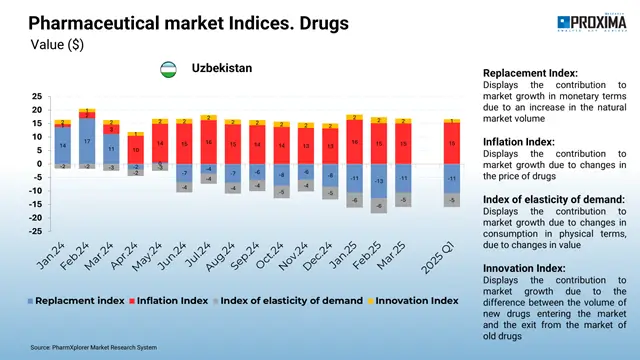
The main driver of growth in the retail medicinal products market in Uzbekistan is inflation, i.e., the increase in the cost of drugs. The innovation index also shows a small positive contribution. The negative substitution and demand elasticity indices signal a reduction in the physical volume of consumption and a redistribution of consumption structure towards more expensive drugs (Fig. 6).
Fig. 6. Indices of sales volume change for medicinal products in the Republic of Uzbekistan from January 2024 to April 2025.
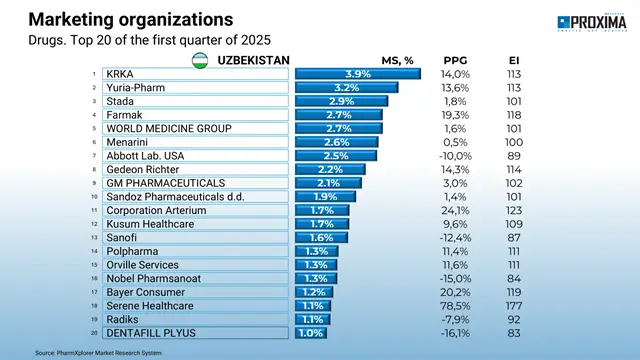
In the ranking of marketing organizations operating in Uzbekistan by drug sales volume, international players lead — KRKA, Yuria-Pharm, and STADA form the top 3, reflecting the openness to imports (Fig. 7).
Fig. 7. Top 20 marketing organizations by retail sales volume of medicinal products in monetary terms in the Republic of Uzbekistan in Q1 2025.
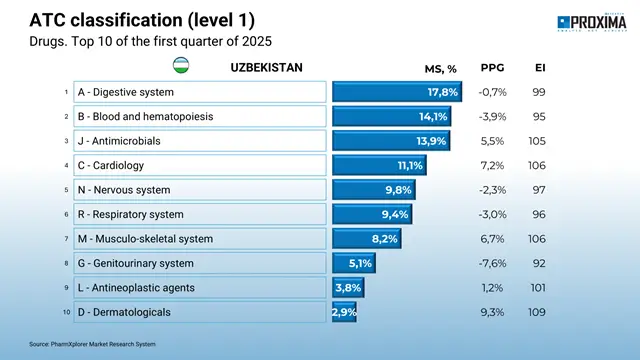
In terms of ATC groups, the leaders in the reviewed period were agents affecting the alimentary tract and metabolism, blood and blood-forming organs, and antimicrobials for systemic use. The largest growth in the top 10 was shown by dermatologicals, as well as agents affecting the cardiovascular system (Fig. 8).
Fig. 8. Top 10 groups of medicinal products by ATC classification level 1 by retail sales volume in monetary terms in the Republic of Uzbekistan in Q1 2025.
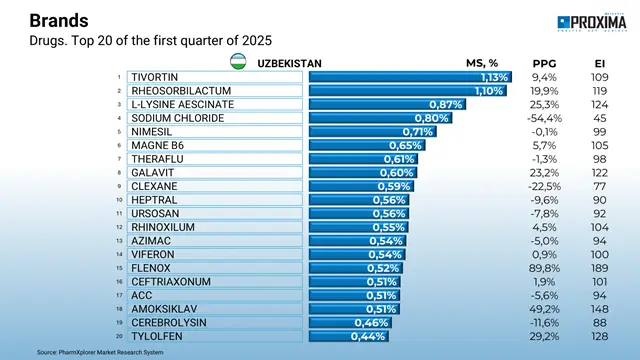
The ranking of drug brands was topped by Tivortin. The top 3 were completed by Reosorbilact and L-lysine aescinat (Fig. 9).
Fig. 9. Top 20 brands of medicinal products by retail sales volume in monetary terms in the Republic of Uzbekistan in Q1 2025.
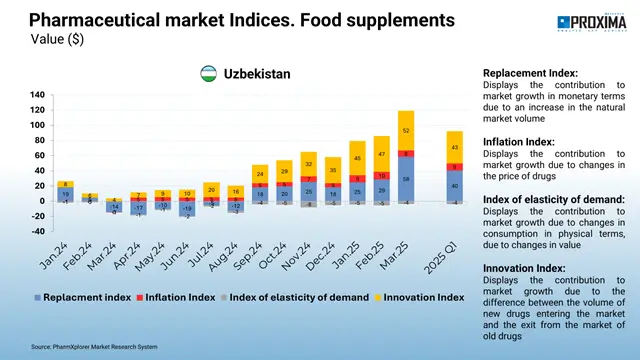
In the dietary supplements segment, the main contribution to market growth is provided by the inflation component and the innovation index. The elasticity index is negative, but its contribution is very small (Fig. 10).
Fig. 10. Indices of sales volume change for dietary supplements in the Republic of Uzbekistan from January 2024 to April 2025.
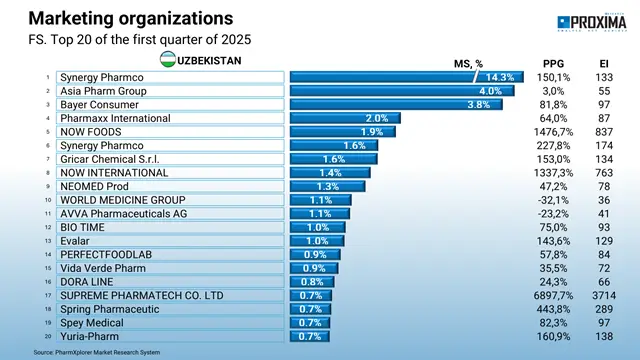
The ranking of marketing organizations – leaders in dietary supplement sales in Uzbekistan – is headed by Synergy Pharmco, Asia Pharm Group, and Bayer Consumer Care (Fig. 11).
Fig. 11. Top 20 marketing organizations by retail sales volume of dietary supplements in monetary terms in the Republic of Uzbekistan in Q1 2025.
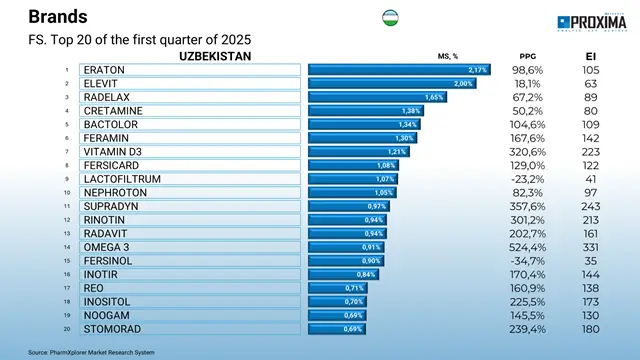
Among the brands, Eraton, Elevit, and Radelax are the leaders (Fig. 12).
Fig. 12. Top 20 brands of dietary supplements by retail sales volume in monetary terms in the Republic of Uzbekistan in Q1 2025.
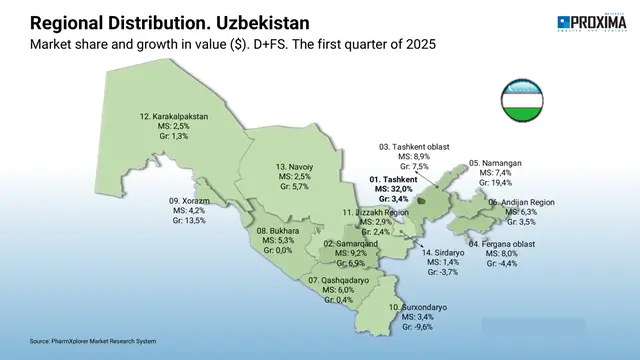
The largest consumption volume is provided by the capital and largest city of Uzbekistan, Tashkent, which accounts for 32% of the turnover. Nevertheless, regions that, although inferior in absolute values, demonstrate high growth rates in sales of medicinal products and dietary supplements in Uzbekistan in Q1 2025 in monetary terms are of interest.
Fig. 13. Regional distribution of consumption volumes of medicinal products and dietary supplements in the Republic of Uzbekistan in Q1 2025.
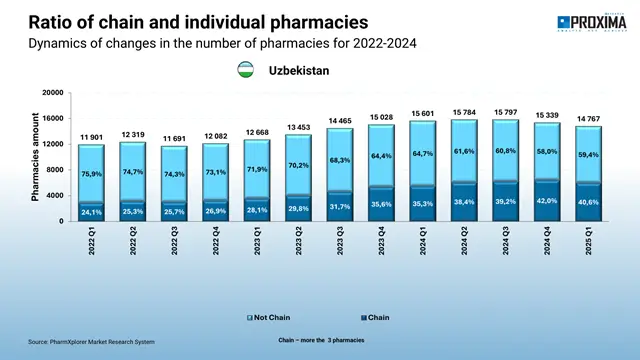
An important vector for the development of the pharmaceutical market in Uzbekistan is the consolidation of the pharmacy business. Data for 2022–2024 show a steady growth in the share of chain pharmacies (3 or more outlets), which are beginning to squeeze out individual players. By Q1 2025, their share is already 40.6%.
Fig. 14. Ratio of chain and individual pharmacies in the Republic of Uzbekistan in dynamics from Q1 2022 to Q1 2025.
The market is growing in monetary terms, but not in packages. In Q1 2025, the pharmaceutical market of Uzbekistan showed a 3.8% increase in monetary terms, but at the same time, a 11.5% decrease in sales volume in physical terms was recorded. Market growth due to prices amid a fall in physical consumption is a worrying signal.
Sales volume change indicators point to a significant influence of the inflation component. In the medicinal products segment, a redistribution of consumption towards more expensive drugs is observed. Additional support is provided by the innovation index. However, while its contribution is small in the medicinal products segment and cannot compensate for the reduction in physical consumption, in the dietary supplements segment it is one of the key growth factors.
Imports remain dominant. Uzbekistan maintains a high dependence on foreign manufacturers: 89% of turnover comes from imported drugs. Despite a 35% share in packages, domestic products account for only 11% in monetary terms.
The growth in the share of chain pharmacies (up to 40.6% by Q1 2025) indicates the consolidation of the pharmacy business and a decrease in the share of individual players. Due to the strengthening role of chain pharmacies, it is important for manufacturers to build partnerships with chains and adapt their promotion strategies.
The capital generates almost a third of the total turnover, but regions with high growth rates are also of interest, making them a promising direction for development. Targeted investments in distribution development and local marketing activities in these territories can provide a significant increase in sales and strengthen brand positions.
Accurate data is essential for making informed strategic decisions. Proxima Research offers Audits for pharmaceutical companies, customized analytical reports and interactive dashboards for the pharmaceutical sector.
Order a detailed pharmaceutical market analysis of your products or competitive drug niches in Uzbekistan, Kazakhstan, and Ukraine. Find growth points for your business!
Contact us to receive a personalized offer.
If the topic of the article caught your interest — leave a request. We’ll discuss how this can work for you.
By clicking the “Submit Application” button, you consent to the processing of personal data and to receiving electronic messages about Proxima Research products and services, and you agree to our Terms of Use. Your data will be processed in accordance with our Privacy Policy. You may unsubscribe at any time.
By clicking the “Subscribe” button, you consent to the processing of personal data and the receipt of electronic messages about Proxima Research products and services, and you agree to our Terms of Use. Your data will be processed in accordance with our Privacy Policy. You can unsubscribe at any time.
or