It is hard to imagine the work of any industry today without the use of digital technologies and data sets. The pharmaceutical market is no exception. Owning information, observing and analysing everything that happens in the pharmaceutical market, keeping abreast of the latest market trends, monitoring the actions of competitors is exactly what all pharmaceutical market participants need. After all, high-quality and timely information makes it possible to quickly react to market changes, effectively manage business processes and marketing, and evaluate the effectiveness of external services. All the necessary information on the functioning of the pharmaceutical market is contained in a set of dashboards of the analytical market research system PharmXplorer by PROXIMA RESEARCH.
SALE IN & SALE OUT
The dashboards provide data on pharmacy sales, pharmacy supplies, and hospital supplies for the 4 main categories of pharmacy basket products (medicines, dietary supplements, medical devices, and cosmetics) for the country as a whole and for individual regions. All data can be displayed in different units of measurement: money (local currency, USD, EUR), packages, DDD (defined daily dose). It is also possible to choose different data periodization: week, month, quarter, year, and in some dashboards, data is available in daily discreteness. It is possible to select several periods at the same time. In addition to simple periods, you can also select aggregated marketing periods: MQT, YTD, MAT (Moving Quarter Total – the moving sum of the specified value for the last three months, Year To Date – the sum of the specified value from the beginning of the year containing the month under study to the selected month inclusive, Moving Annual Total – the moving sum of the specified value for the last 12 months).
Dashboards display data on the market as a whole and various analytical structures of the market.
Filters are available to refine your search. Using them, you can display sales and/or supply data in different sections by:
- marketing organizations,
- distributors,
- international non-proprietary names (INN),
- brands,
- trade names,
- drug’s prescription status,
- different levels of ATC classification,
- administration methods,
- dosage forms,
- in the context of domestic/foreign goods (both by place of production and by country of the license certificate holder), etc.
There are also filters for classifying dietary supplements, cosmetics, medical devices, etc.
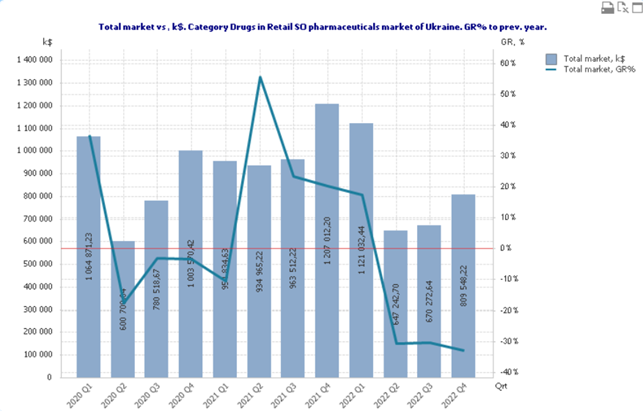
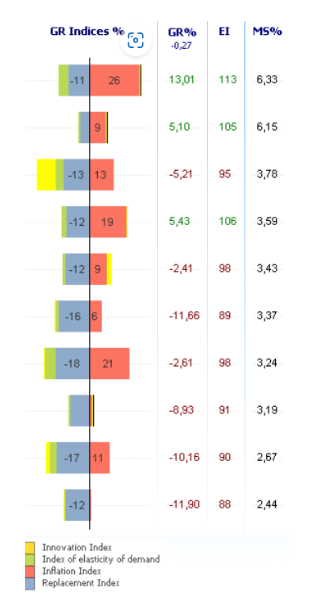
Dashboards can be used to build ratings in various sections, and with the help of integrated growth indices (substitution/natural consumption, inflation, demand elasticity, innovation), we can draw conclusions about the reasons for the growth or decline in volumes.
Example: Rating tab, TOP 10 in money (USD) in the category of medicines, retail sales, pharmaceutical market of Ukraine.
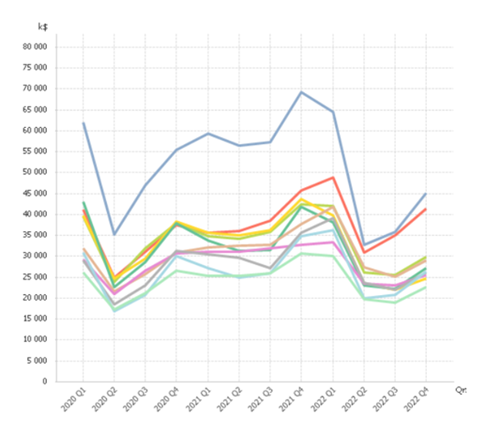
In addition to analyzing a static period, the Rating tab has additional sections that display analytical data in dynamics. To track changes that occur in different periods of time, seasons, and other time periods.
Example: the Dynamics tab, which displays the dynamics of sales, promotional activity, prices, penetration, and advertising for the selected period. TOP 10 in money (USD) in the category of medicines retail sales, pharmaceutical market of Ukraine.
The “Group” button allows you to select competitive groups formed individually according to the user’s request. Pre-configured filters for generating regular reports are integrated into the dashboards, which greatly facilitates the work with data and adds convenience.
Data can be displayed in tabular or graphical form. Special buttons allow you to maximize, print or export the displayed data to Excell. There is a panel below the graph to select the data to be displayed. According to the set parameters, sales data, market share, or evolutionary index can be displayed.
PROMO TEST & RX TEST.Ukraine
PROMO TEST dashboards are aimed at analyzing promotional/advertising activity, which involves a comprehensive assessment by promotion channels, target groups of specialists, brands and marketing organizations. Analytical data on promotion is available for medicines, cosmetics, dietary supplements, medical devices and baby food.
Data is available on the following types of promotion mentioned by healthcare professionals: medical representatives’ visits; conferences/seminars; POS materials; remote communication (SMS, Viber, etc.); mailings; emails; promotion through medical representatives’ calls; promotions; advertising in specialized press; advertising on television (TV); advertising/information on the Internet; advertising on radio.
Example. Market dynamics tab of Promo Test. Ukraine.
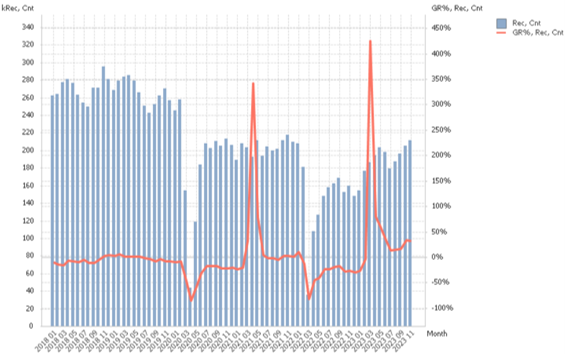
- Shows the dynamics of doctors/pharmacists recalls according to market filters by specialties, periods, competitive groups, etc
- Usually used in the general market or competitive group to assess the dynamics of advertising pressure
- Provides a quick understanding of the level of advertising pressure from all players in the Market Segment and its growth trends (positive or negative)
The RX TEST dashboard allows you to analyze physician prescriptions by ICD-10 diagnoses (main diagnosis, complications of the main diagnosis, and related diagnoses), INN, brands, and marketing organizations for a specific period or in dynamics. The dashboard also allows you to evaluate patient flow, characteristics of their diseases, and the duration of appointments.
Example. The Prescription Overview tab of Rx Test. Ukraine.
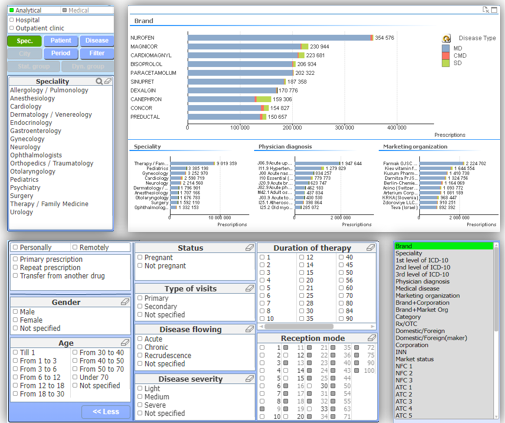
- Displays the ranking in physical terms and MS% of HCPs prescriptions according to market filters by brands, specialties, diagnoses, consumer segments by age, gender, aggregated marketing periods (Month, YTD, MAT), competitive groups, diagnosis types, etc
- Is used in a competitive market to assess the rating of indicators by brands, marketing organization, INN, etc., own advertising position and search for major competitors using filters
- Provides a quick analysis of the competitive situation, main diagnoses and specialties of HCPs by all possible filters
The monitoring is conducted by telephone interview and online survey based on a standardized questionnaire. Pharmacists, procurement experts and doctors of various specialties (general practitioners/family doctors, gynecologists, pediatricians, neurologists, cardiologists, otolaryngologists, surgeons, anesthesiologists, orthopedists/traumatologists, psychiatrists, dermatologists/venereologists, endocrinologists, allergists/pulmonologists, gastroenterologists, urologists, ophthalmologists, oncologists, etc.) The list of specialties depends on the country in question.
PharmXplorer is an important resource for the pharmaceutical market. Companies in different countries seeking to be successful in a competitive environment use the analytical data from PROXIMA RESEARCH.
ASK QUESTIONS