As you know Proxima Research has launched a new Sell Out product and became the first company in the Uzbekistan market, providing analytics based on the data of sales from pharmacies rather than shipments to the pharmacy. Sell Out data allows to get the most accurate and complete report on sales of goods from pharmacy, giving information on direct sale of goods to the end consumer. Data on pharmacy sales of Drugs and Dietary Supplements are available today. This publication presents the key indicators of the retail pharmaceutical market in Uzbekistan in Q1 2024. Data from the analytical market research system “PharmXplorer” of “Proxima Research” company were used in the preparation of the material.
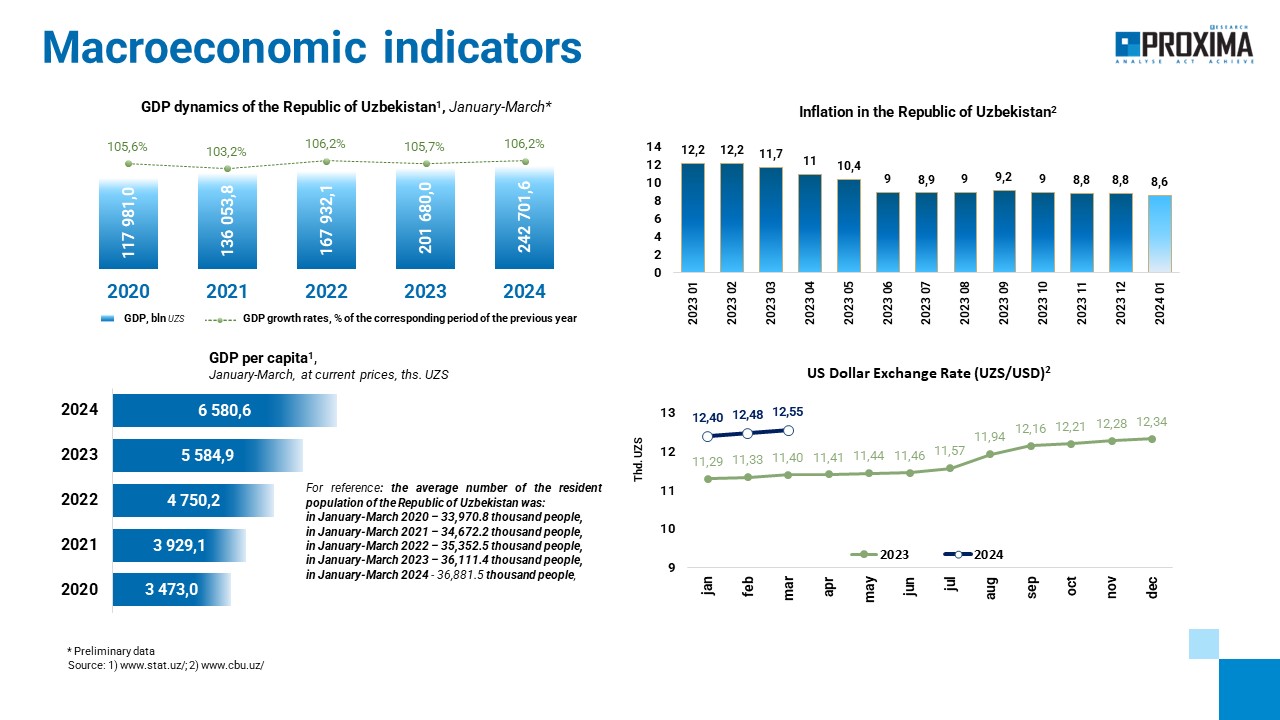
The development of the pharmaceutical market is significantly influenced by economic macro-indicators. The economy of Uzbekistan demonstrates constant growth. According to preliminary data, in the first quarter of 2024 GDP grew by 6.2%. GDP per capita is also growing, while the number of population is also increasing. Considering the dynamics of inflation, its gradual decline is recorded. However, the exchange rate of the national currency against the US dollar is weakening, which can contribute to an increase in prices (Fig. 1).
Fig. 1 Key macro-indicators of the Republic of Uzbekistan
GENERAL MARKET TRENDS
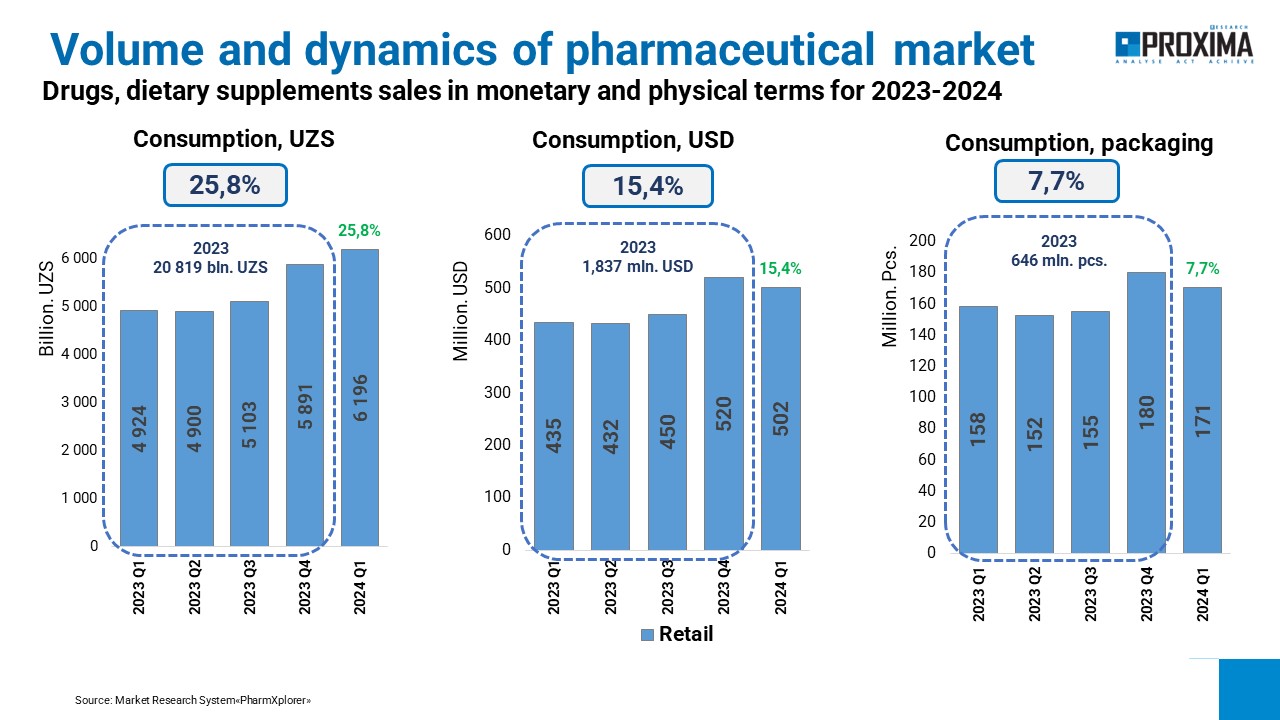
The pharmaceutical market in Uzbekistan is also actively developing, demonstrating an increase in sales volumes. At the end of 2023, the volume of Drug and Dietary supplements retail sales amount to UZS 20.8 trillion, which in currency equivalent is USD 1.8 billion. In packs, the volume of pharmacy sales amounted to 646 million packs. In Q1 2024, the sales volume in national currency amounted to UZS 6.2 trillion and increased by 26% compared to the same period of 2023. In dollar terms, the increase was 15%, and in packs – 8% (Fig.2).
Fig. 2 Quarterly dynamics of Drug and Dietary supplements pharmacy sales
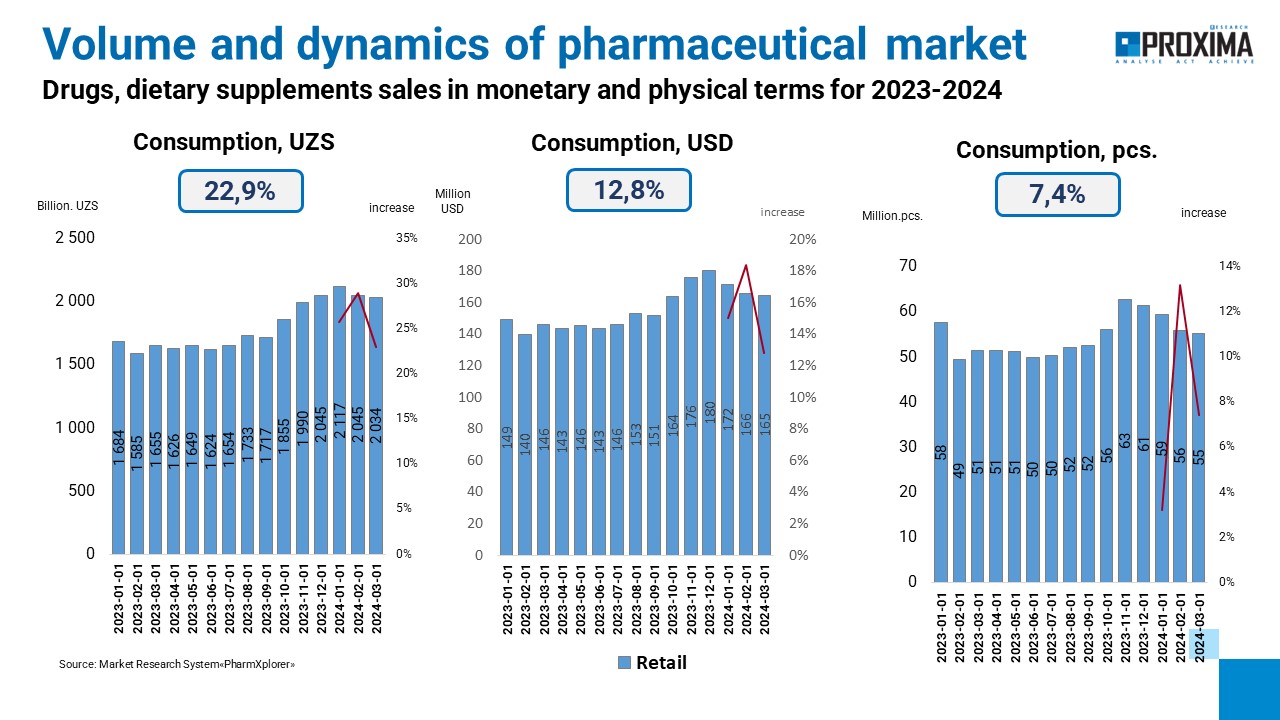
 Looking at the monthly sales dynamics, we can note double-digit growth rates in January-March 2024 in monetary terms compared to the same period of 2023. In packages, the growth rates are somewhat lower, but also quite high and in March 2024 amount to 7.4% (Fig. 3).
Fig. 3 Monthly dynamics of Drugs and Dietary supplements pharmacy sales
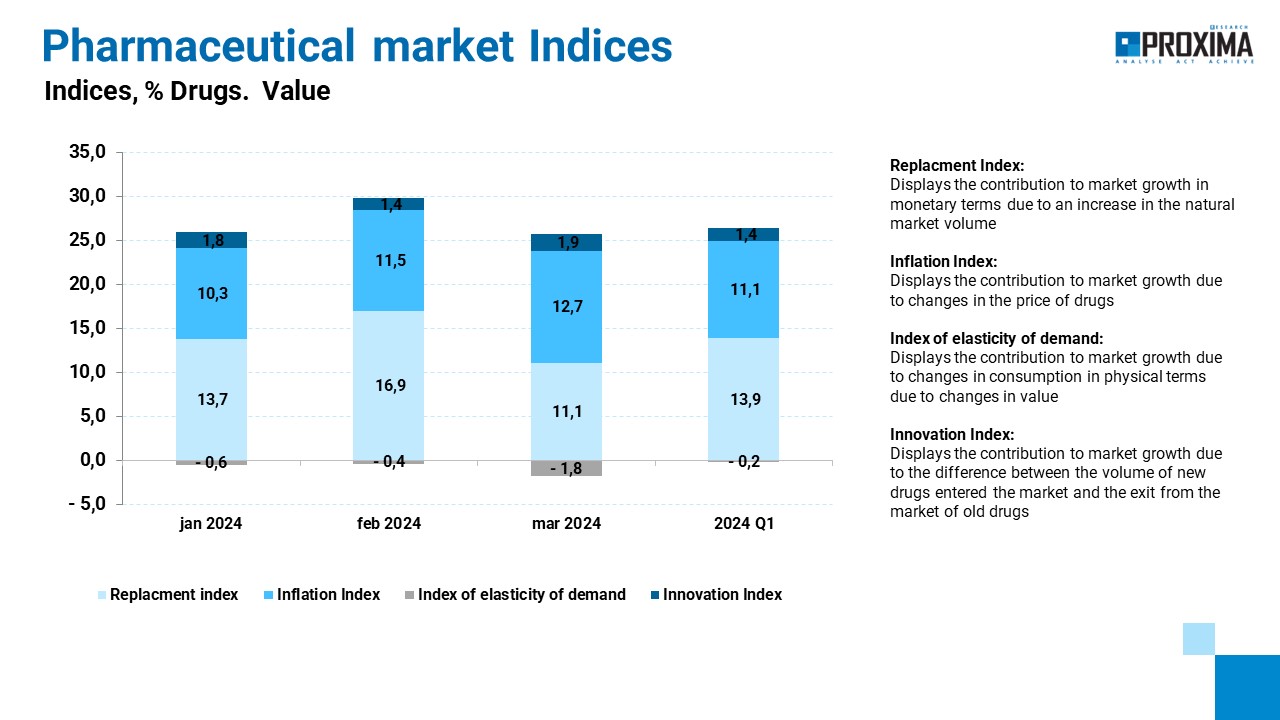
 Analysis of the dynamics of change indices in pharmacy sales of Drugs in monetary terms shows that in Q1 2024 the main indicators affecting the market development are the substitution index and inflation index (Fig. 4).
Fig. 4 Change indicators of pharmacy sales of Drugs in monetary terms in Q1 2024 compared to the same period of the previous year
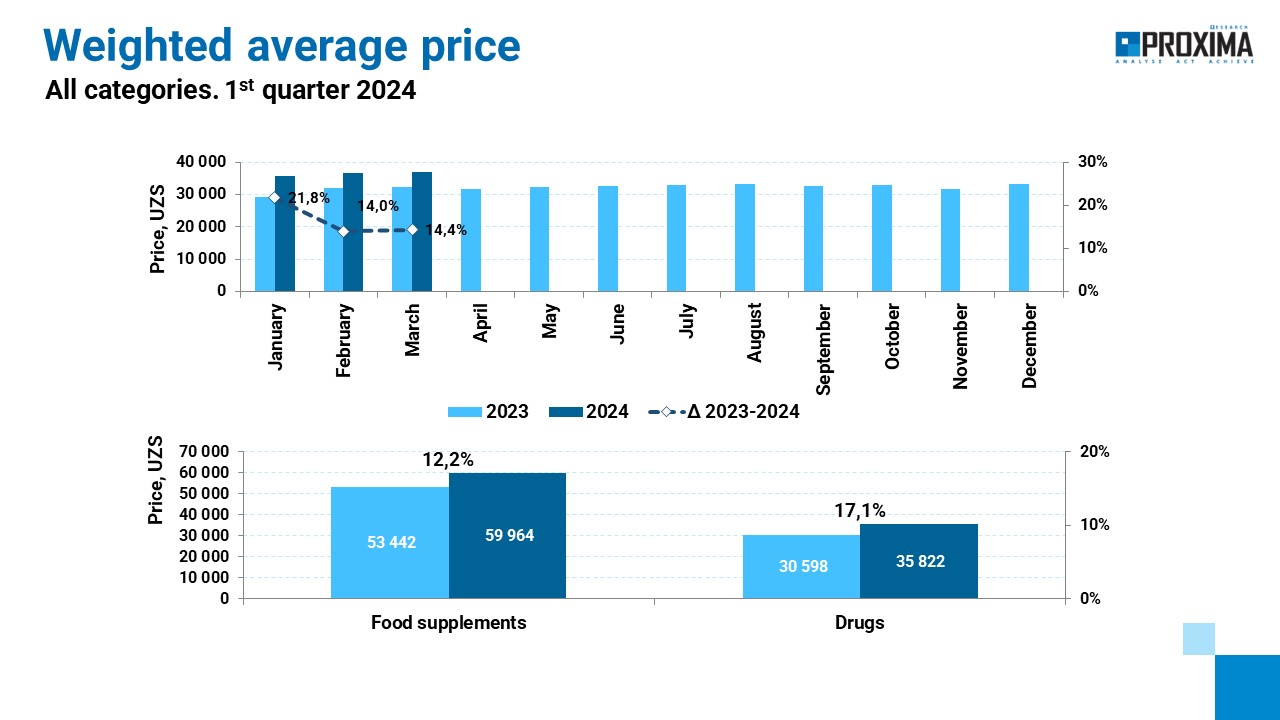
 In the first quarter of 2024, the weighted average cost of 1 package of Drugs amounted to UZS 35.8 thousand and increased by 17.1% compared to the first quarter of 2023. For Dietary supplements, this indicator amounted to UZS 60 thousand and increased by 12.2% (Fig. 5). It is important to understand that the increase in the weighted average cost reflects not only an increase in price, but also a change in the consumption structure towards more expensive drugs.
Fig. 5 Dynamics of weighted average cost of 1 pack of Drugs and Dietary Supplements
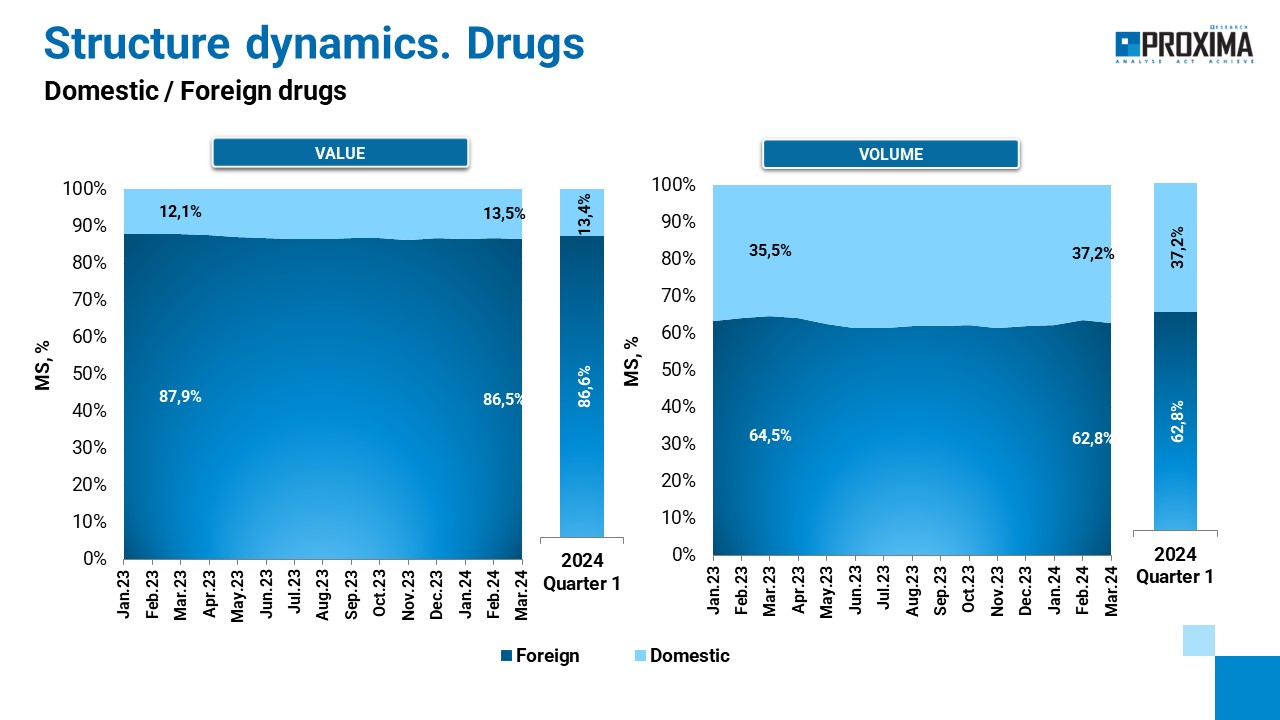
Imported Drugs prevail in the structure of retail sales of medicines in the Uzbek market both in monetary and in physical terms. In Q1 2024, the share of domestic Drugs is 13.4% in monetary terms and 37.2% in physical terms (Fig. 6). That is, the Uzbekistan market is largely import-dependent. To increase the share of domestic Drugs in the market, Uzbekistan is implementing the project of innovative scientific and production pharmaceutical cluster Tashkent Pharma Park, which was created to provide a favorable environment for the development of pharmaceutical enterprises, research, and innovation in the field of medical technologies. And the dynamics of the structure of pharmacy sales indicates a gradual increase in the share of domestic products.
Fig. 6 Structure of pharmacy sales of domestic and foreign Drugs
In terms of Drug prescription status, prescription medicines (Rx) prevail in the market of Uzbekistan. At the end of March 2024, the share of Drugs prescription is 73.3% in monetary terms and 67.8% in physical terms. It is also worth noting the trend of increasing share of Rx category in the total market volume.
KEY PLAYERS
In Q1 2024, the leaders in terms of Drugs retail sales in monetary terms among marketing organizations are KRKA, Stada and Yuria Farm. Among the Drug brands, the highest sales volume was recorded for Sodium Chloride, TIVORTIN and RHEOSORBILACTUM (Fig. 7).
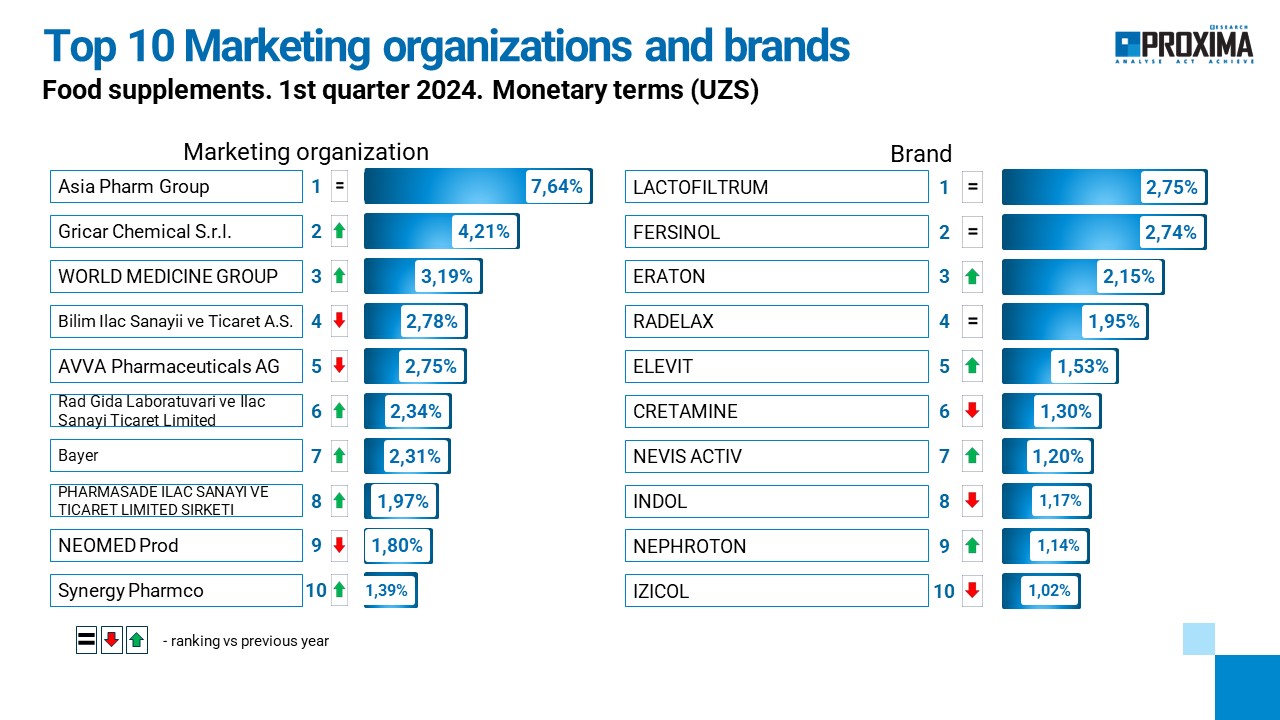
Asia Pharm Group, Gricar Chemical S.r.l. and WARLD MEDICAL GROUP were the leaders in similar rankings in the Dietary Supplements segment. Among the brands are LACTOFILTRUM, FERSINOL and ERATON (Fig. 8).
Fig. 7 Top 10 marketing organizations and brands by Drugs sales volume in monetary terms by the end of Q1 2024.
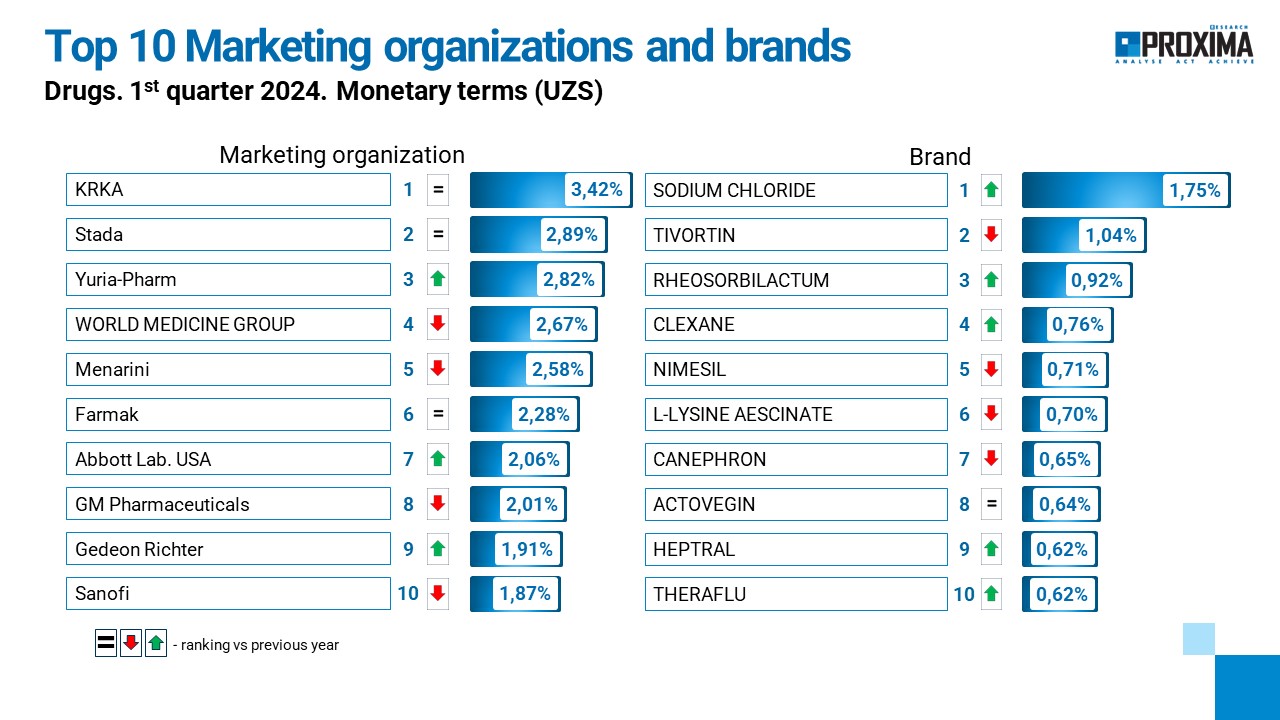 Fig. 8 Top 10 marketing organizations and brands of Dietary supplements by sales volume in monetary terms at the end of Q1 2024.
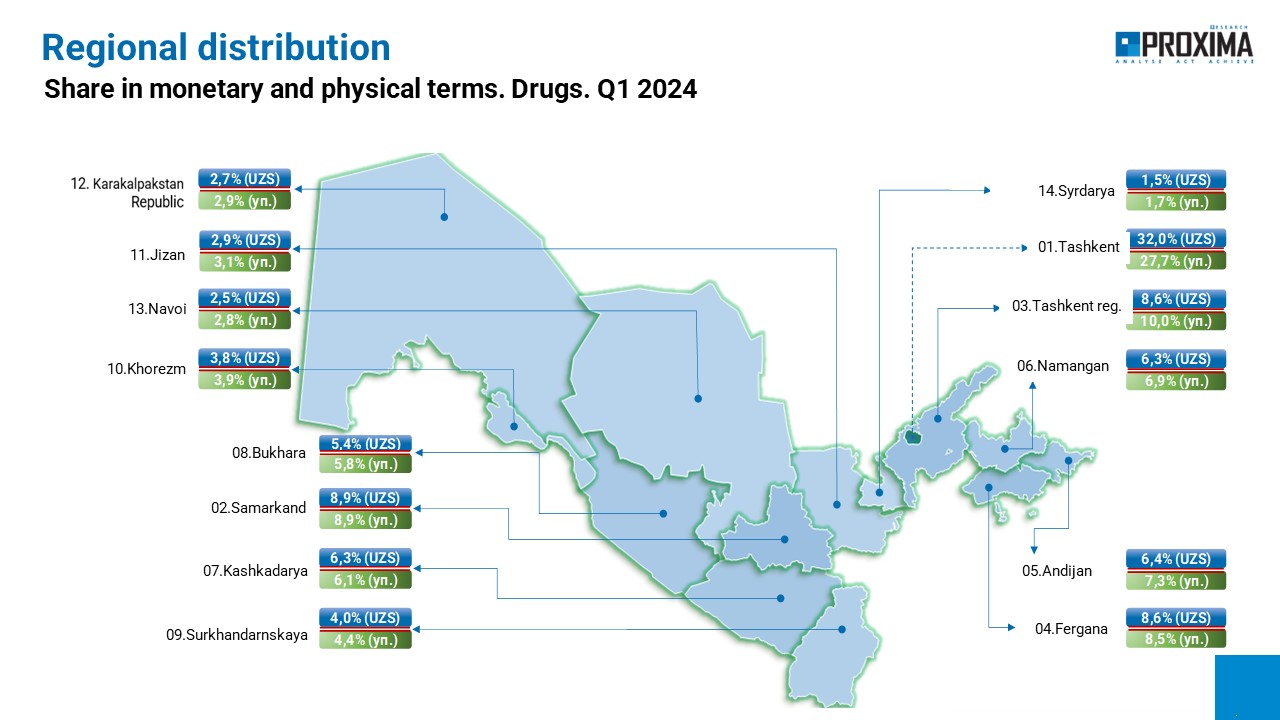
Pharmacy sales by region vary widely and depend largely on the population and economic development of the region. It is worth noting that 32% of pharmacy sales of medicines in monetary terms and 28% in physical terms are in Tashkent city (Figure 9).
Fig. 9 Regional distribution of Drugs pharmacy sales in Q1 2024.
LEARN MORE