The Ukrainian pharmaceutical market in June 2025: growth amid subdued consumption
01.08.2025
The pharmaceutical market of Ukraine in June 2025 shows growth amid restrained consumption. Proxima Research International—a leading provider of business intelligence for the pharmaceutical industry—presents current data and a development forecast for the retail pharmaceutical market for June 2025. The study covers a wide range of “pharmacy basket” goods, broken down by category, region, and price, with analysis in monetary and volume terms. Thanks to the new competitive group forecasting module, the market assessment has become even more precise and strategically valuable for the pharmaceutical business.
Sales Dynamics: In Figures
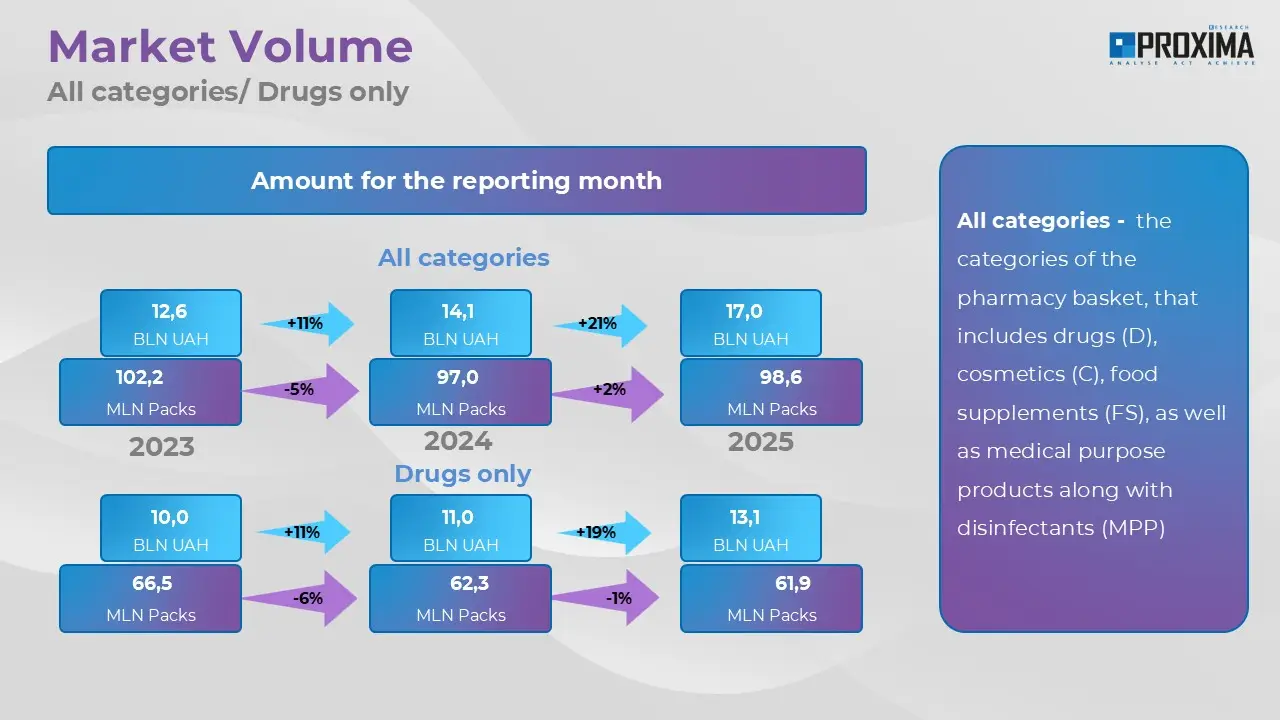
As of June 2025, the total retail consumption of “pharmacy basket” goods (medicines, cosmetics, dietary supplements, medical devices) increased by 21% compared to the same period last year, reaching UAH 17 billion (USD 407.8 million). Meanwhile, the number of packages sold remained almost unchanged (with a growth of 2%), at 98.6 million. The lion’s share of the market is held by medicines, accounting for UAH 13.1 billion (77.1%) in monetary terms and 61.9 million (62.8%) packages in volume (Fig. 1).
Fig. 1.Retail sales volume of “pharmacy basket” goods in total and medicines specifically in June 2023-2025.
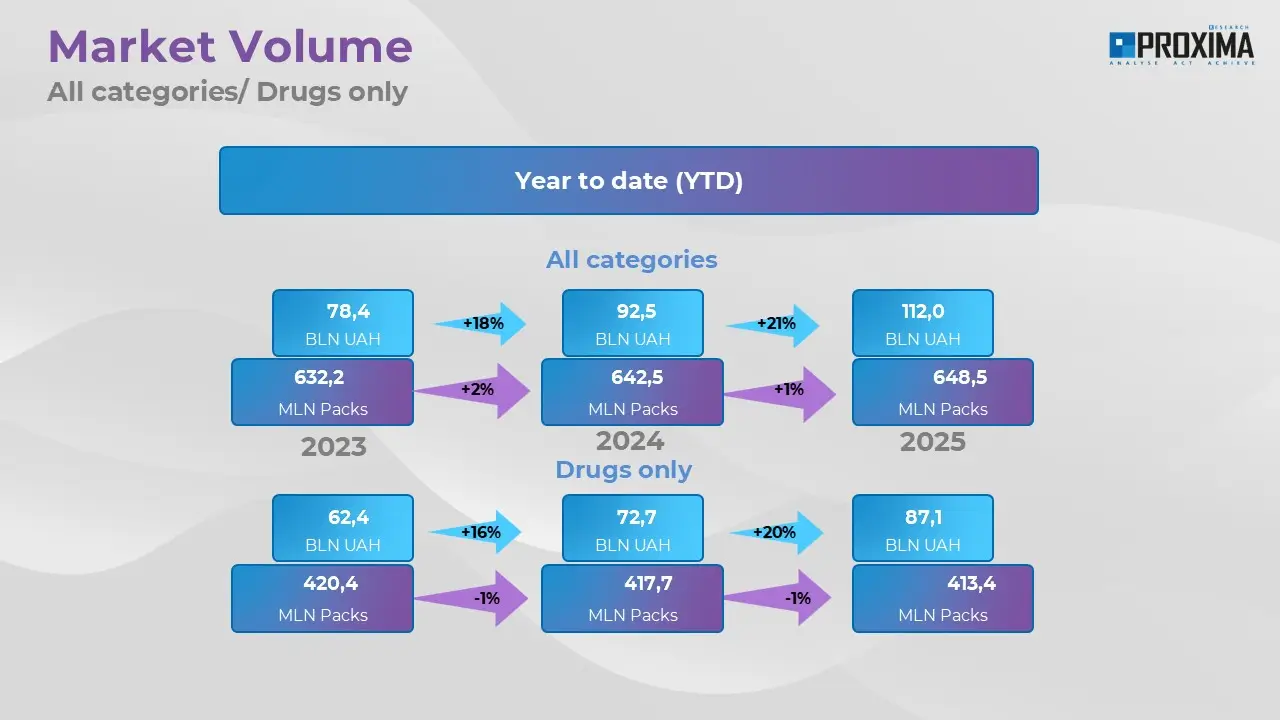
From the beginning of the year to June (YTD), the sales volume of “pharmacy basket” goods reached UAH 112.0 billion, which is 21% more than the same period in 2024. The quantity of products sold in volume terms increased by only 1% to 648.5 million packages, indicating a trend towards a higher average cost of goods. Of this, UAH 87.1 billion and 413.4 million packages are attributed to medicines (Fig. 2).
Fig. 2.Retail sales volume of “pharmacy basket” goods in total and medicines specifically from January to June 2023-2025.
According to the MAT (Moving Annual Total) for the period from July 2024 to June 2025, the retail sales volume of “pharmacy basket” goods also shows confident growth in monetary terms (+20% to UAH 214.3 billion) and remains almost flat in volume (+1% to 1,301.2 million packages).
Growth Factors
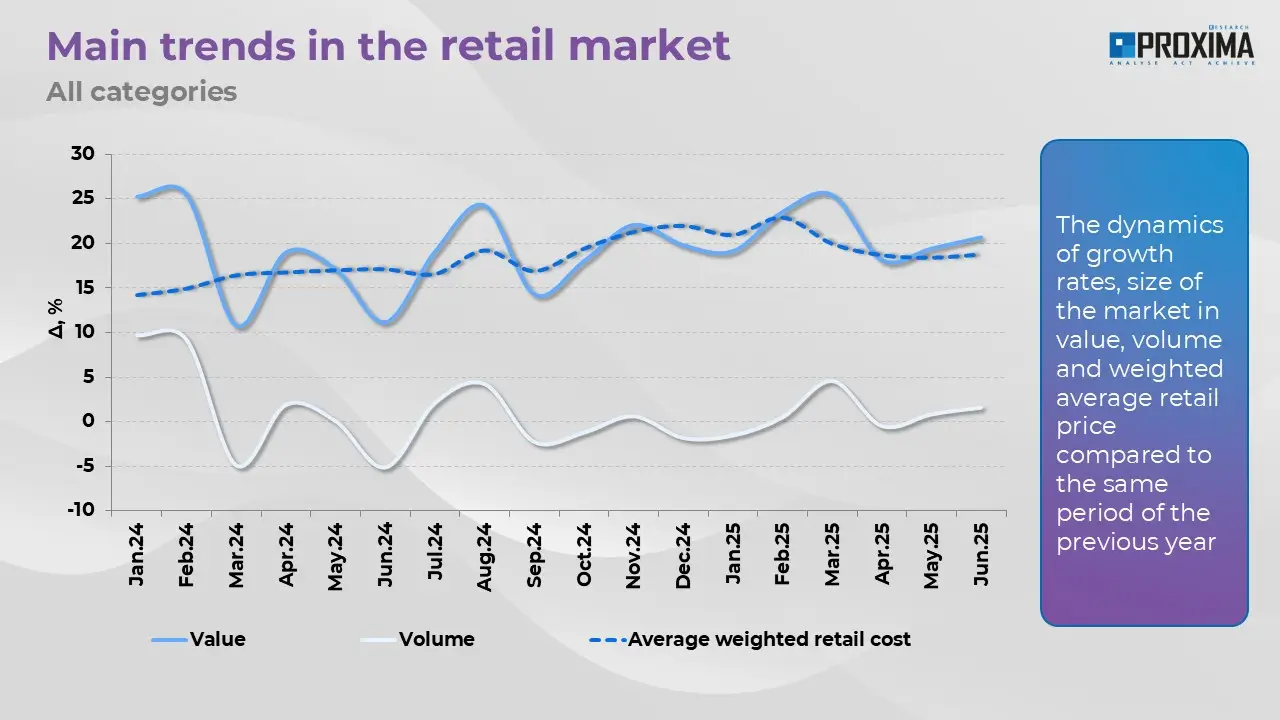
The market growth in monetary terms, with relatively stable or moderate growth in the number of packages sold, indicates that the main growth driver remains the increase in retail prices (Fig. 3).
Fig. 3.Monthly dynamics of “pharmacy basket” sales volume in monetary and volume terms, showing the change in the weighted average cost of 1 package from January 2024 to June 2025.
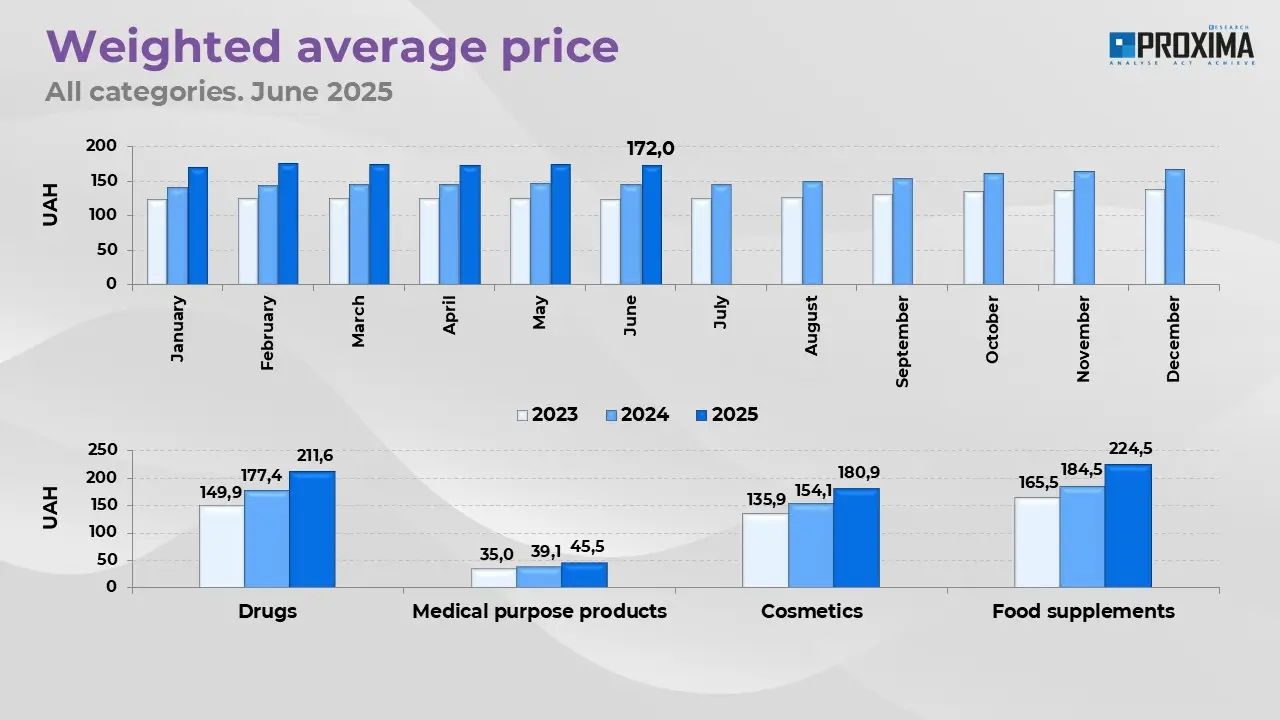
In June 2025, the weighted average cost of one package of “pharmacy basket” goods reached UAH 172.0. This indicator is growing across all segments. The most expensive categories are dietary supplements and medicines (Fig. 4).
Fig. 4.Weighted average retail cost of “pharmacy basket” categories.
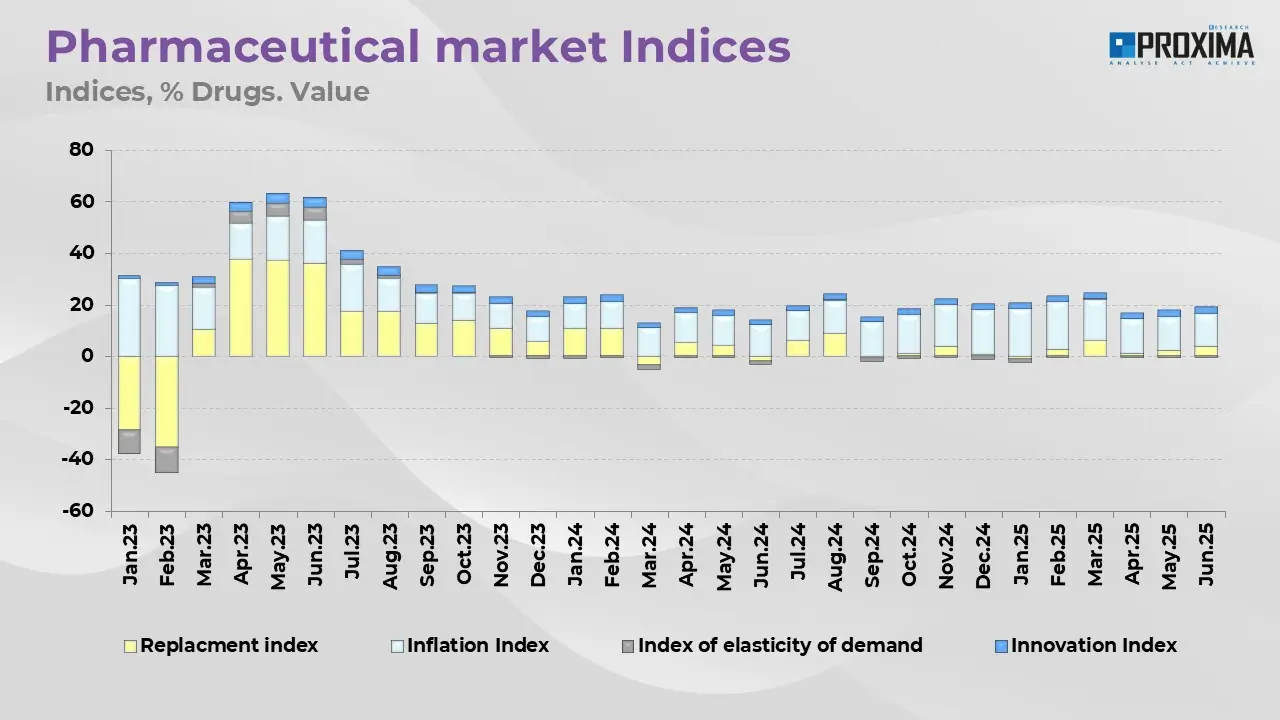
A study of medicine sales change indices shows that the main growth driver in the first half of 2025 is the inflation index. Other growth factors include the substitution index, which indicates a redistribution of consumption towards more expensive goods, and the innovation index, which points to a moderate renewal of the product range with new brands. The price elasticity of demand index is negative, but its impact is insignificant, which may indicate low consumer sensitivity to price changes (Fig. 5).
Fig. 5.Dynamics of medicine sales volume change indices from January 2023 to June 2025.
Changes in Market Structure
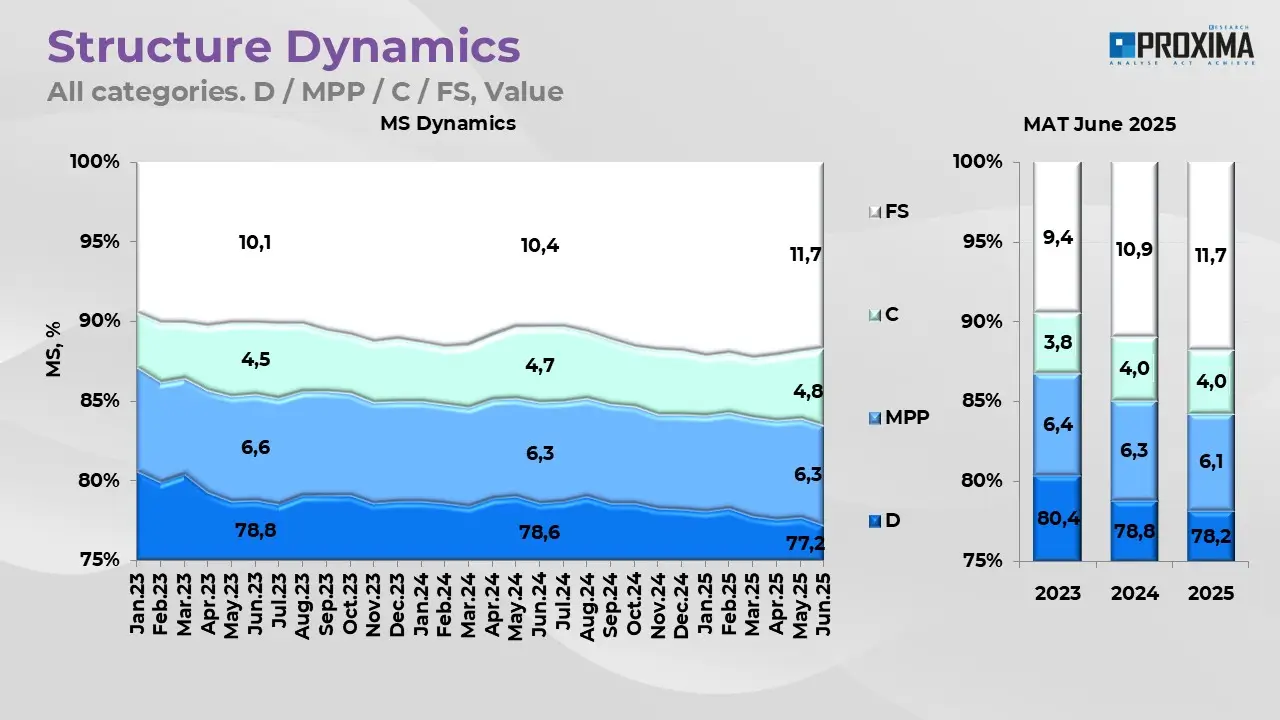
Among “pharmacy basket” goods, medicines remain the dominant category, but the share of dietary supplements in the consumption structure has noticeably increased in recent years. As of June 2025, medicines account for 77.2% of sales volume, dietary supplements for 11.7%, medical devices for 6.3%, and cosmetics for 4.8% (Fig. 6).
Fig. 6.Dynamics of the retail sales volume structure of “pharmacy basket” goods by category from January 2023 to June 2025.
In volume terms, the shares shift slightly: the more affordable category, medical devices, provides a larger sales volume due to a lower unit cost—23.7%. Medicines account for 62.7% of sales, dietary supplements for 9%, and cosmetics for 4.6%.
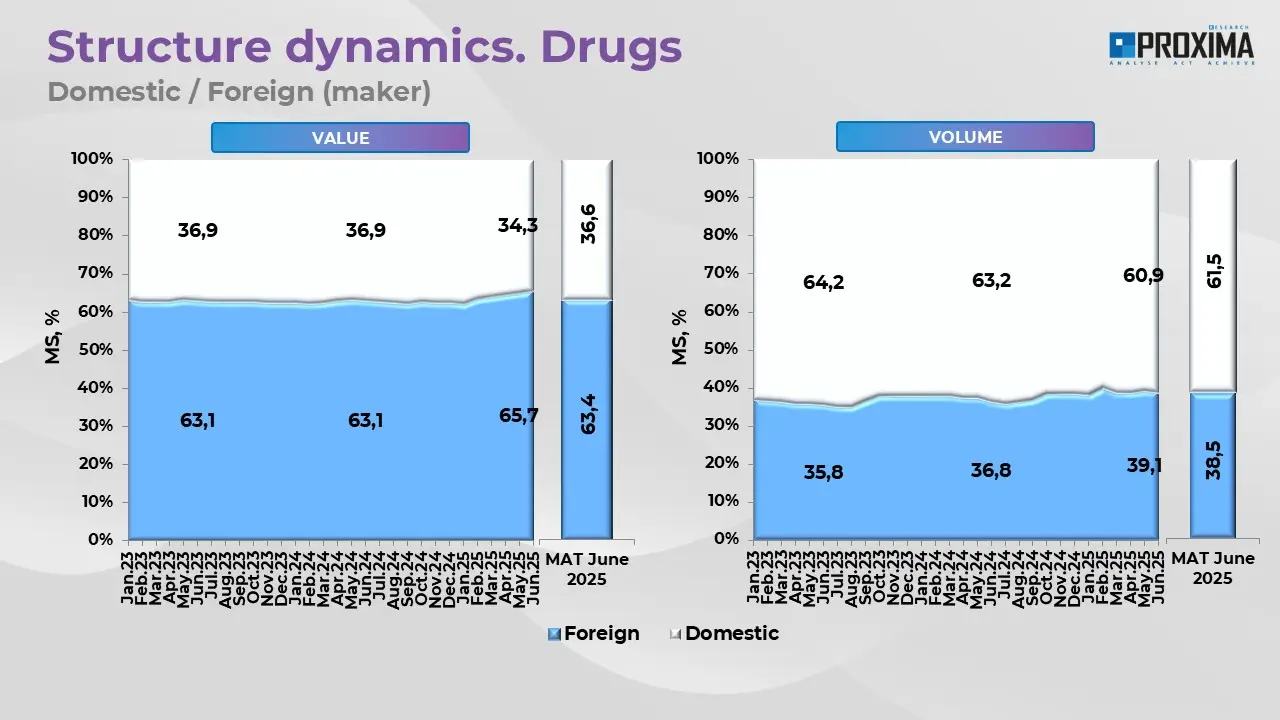
In terms of country of origin, foreign medicines maintain the lead in monetary terms (with their share tending to grow), accounting for 63.4% of retail medicine sales in June 2025, while Ukrainian medicines account for 34.3%. However, in volume terms, the situation changes drastically: domestic drugs occupy 60.9% of the market, while foreign drugs account for 39.1%, which may be due to the better price affordability of Ukrainian drugs (Fig. 7).
Fig. 7.Dynamics of the retail medicine sales volume structure by domestic and imported goods from January 2023 to June 2025.
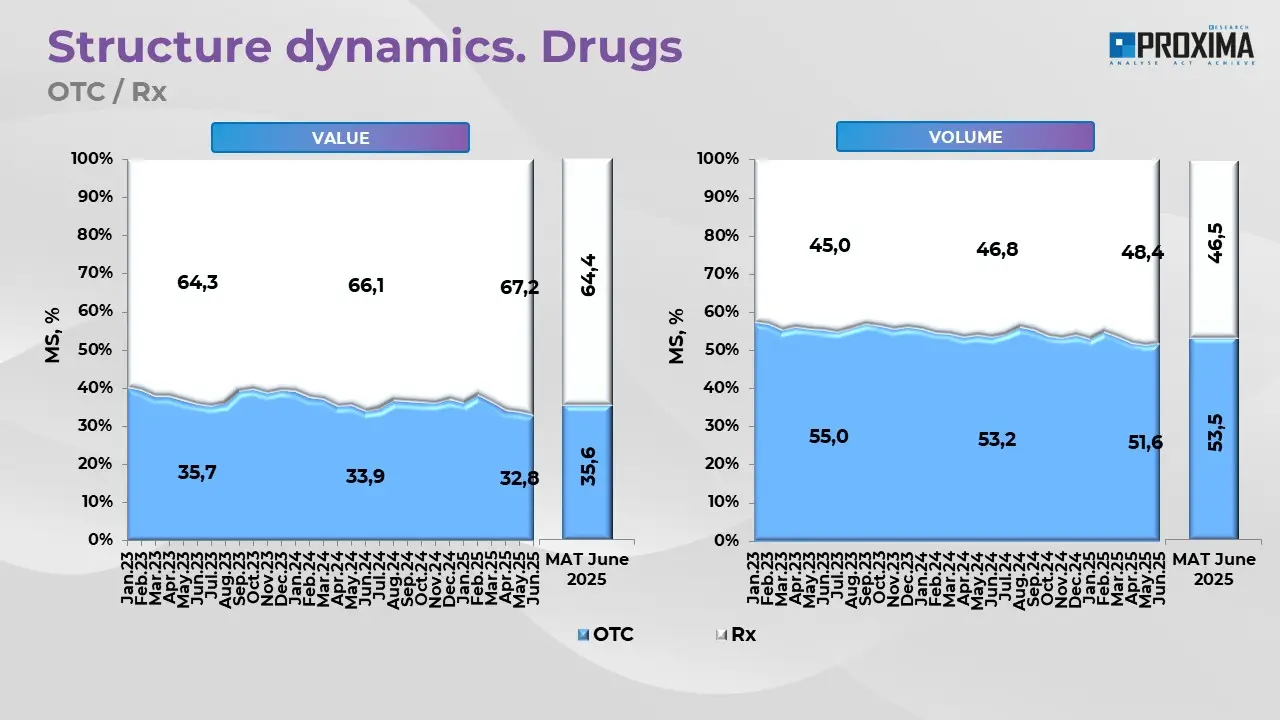
In the structure of the medicine market by prescription status, prescription drugs have an advantage in monetary terms with a share of 67.2% in June 2025. However, in volume terms, over-the-counter (OTC) medicines prevail, accounting for 51.6% of sales volume (Fig. 8).
Fig. 8.Dynamics of the retail medicine sales volume structure by prescription status from January 2023 to June 2025.
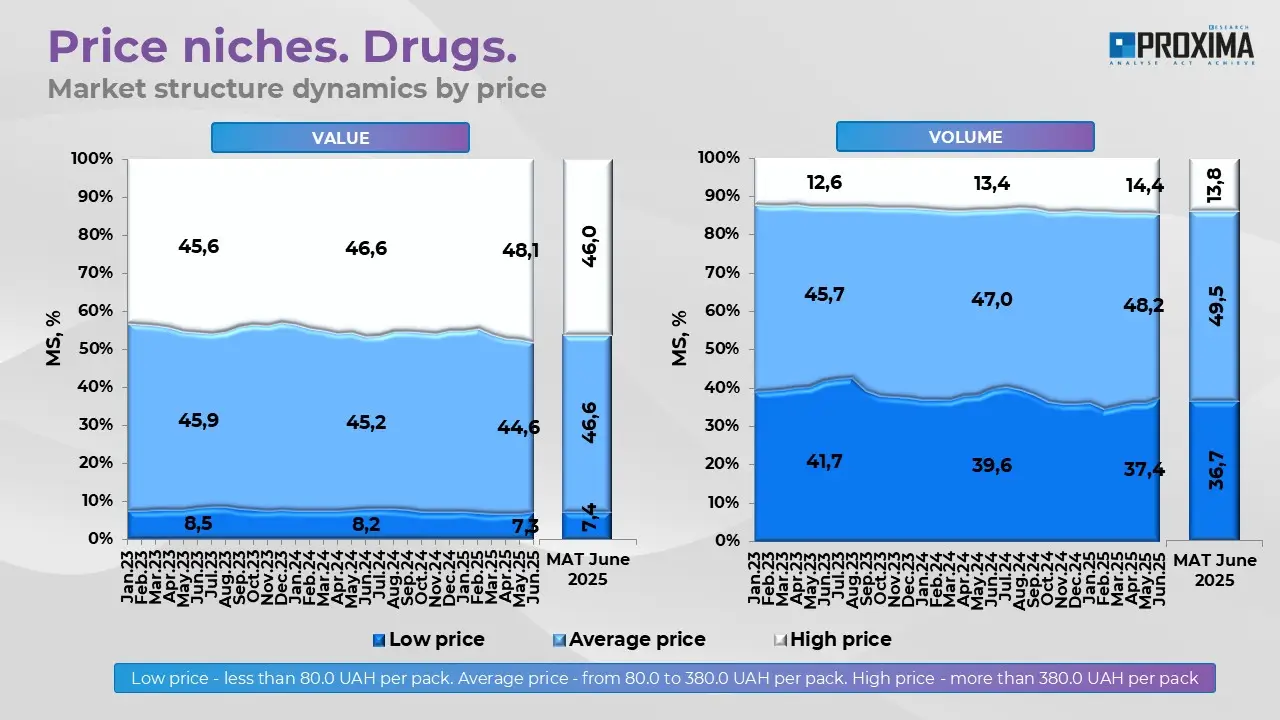
Regarding price segments of medicines, the largest share in monetary terms is held by mid-priced drugs (from UAH 80 to UAH 380 per package), with an indicator of 44.6% in June 2025. In volume terms, their share is also high at 48.2%. High-priced drugs (costing more than UAH 380) account for only 14.4% of sales in volume but provide 48.1% in monetary terms. In contrast, low-priced drugs (up to UAH 80) are sold in large volumes, forming 37.4% of the market in packages, but their contribution to sales in monetary terms is only 7.3% (Fig. 9).
Fig. 9.Dynamics of the retail medicine sales volume structure by price niches from January 2023 to June 2025.
In the therapeutic breakdown (according to ATC classification level I), the top five leaders are medicines affecting the digestive system and metabolism, cardiovascular system, nervous system, musculoskeletal system, and respiratory system. This distribution reflects both seasonal fluctuations and the needs of patients with chronic diseases.
Next-level analytics: not just numbers, but consumption forecasting
Assessing growth rates, the dynamics of the weighted average cost of one package, sales volume change indices, and monitoring changes in consumption structure are all undoubtedly necessary for understanding market development and current trends. However, this is no longer enough for the modern pharmaceutical business. Strategic planning requires greater depth, detail, and predictability—and this is precisely the need that the new generation of analytical services addresses.
A true breakthrough in market analytics has been the competitive group forecasting module, implemented in the Market Audit system by Proxima Research International. This innovative solution, which has no analogues in the Ukrainian market, allows a shift from assessing actual results to proactive forecasting. And not just for the market as a whole, but also within the competitive environment tailored to a specific client.
Many players in the pharmaceutical market are already familiar with the Group Maker tool, which allows them to create their own competitive groups. Now, these capabilities are enhanced with deep predictive analytics: the module allows you to see the group’s development perspective for 18 months ahead, with monthly data updates in UAH, USD, EUR, and volume (packages). Forecasts are generated automatically using modern machine learning technologies, which reduces the risk of human error.
At the core of the new service is the AutoGluon platform, which automatically selects the best forecasting model. The system considers historical dynamics, seasonality, demand cyclicality, the impact of external economic factors, and identifies and smooths out atypical anomalies. In 91 out of 100 INNs, the forecast error rate does not exceed 10%, indicating a high level of accuracy.
What is particularly valuable is that the tool allows for the analysis of a company’s real position within its own competitive field, without relying solely on generalized market trends. This vision opens new horizons for stakeholders, including rapid response to changes in demand within a specific segment.
Thus, the competitive group forecasting module is not just another technological novelty, but a strategic resource that allows companies to act proactively and make informed decisions based on accurate and dynamic data. In conditions of high competition and market turbulence, this means more confidence, fewer risks, and a precise focus on consumer behavior.
Market Players: Who Holds the Lead?
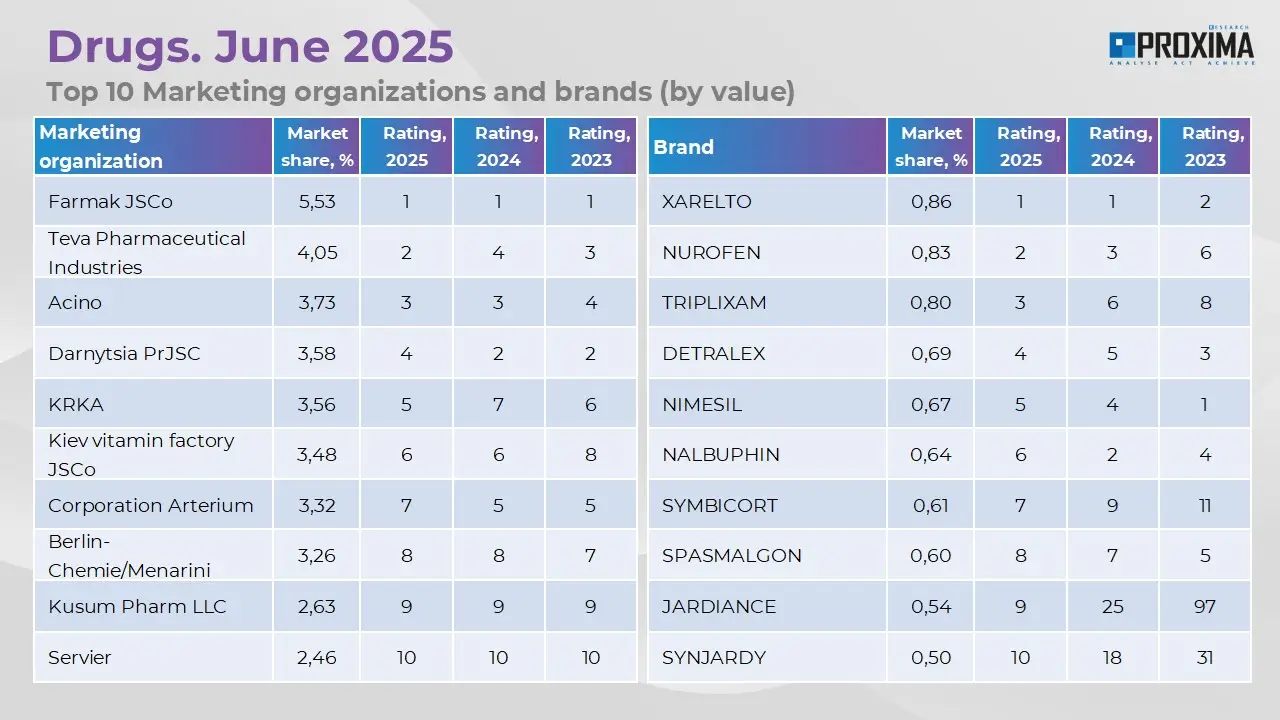
As of June 2025, the leaders in pharmacy sales volume of medicines are Farmak, Teva, Acino, Darnitsa, and KRKA. Among brands, the top positions are held by Xarelto, Nurofen, Triplixam, Detralex, and Nimesil (Fig. 10).
Fig. 10.Top 10 marketing organizations by retail sales volume of medicines and brands in June 2025.
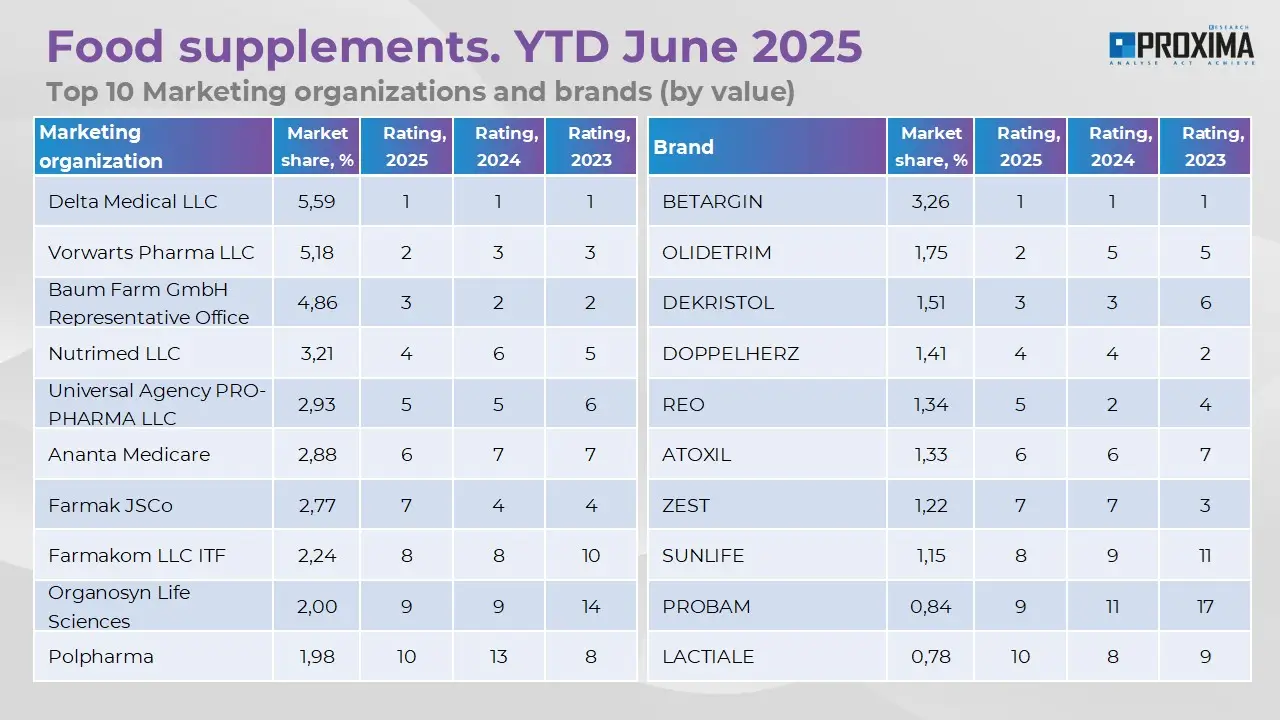
In the dietary supplements segment, the leading companies are Worwag Pharma, Delta Medical, and the representative office of Baum Pharm, while the top brands are Betargin, Atoxil, and Doppelherz (Fig. 11).
Fig. 11.Top 10 marketing organizations by retail sales volume of dietary supplements and brands in June 2025.
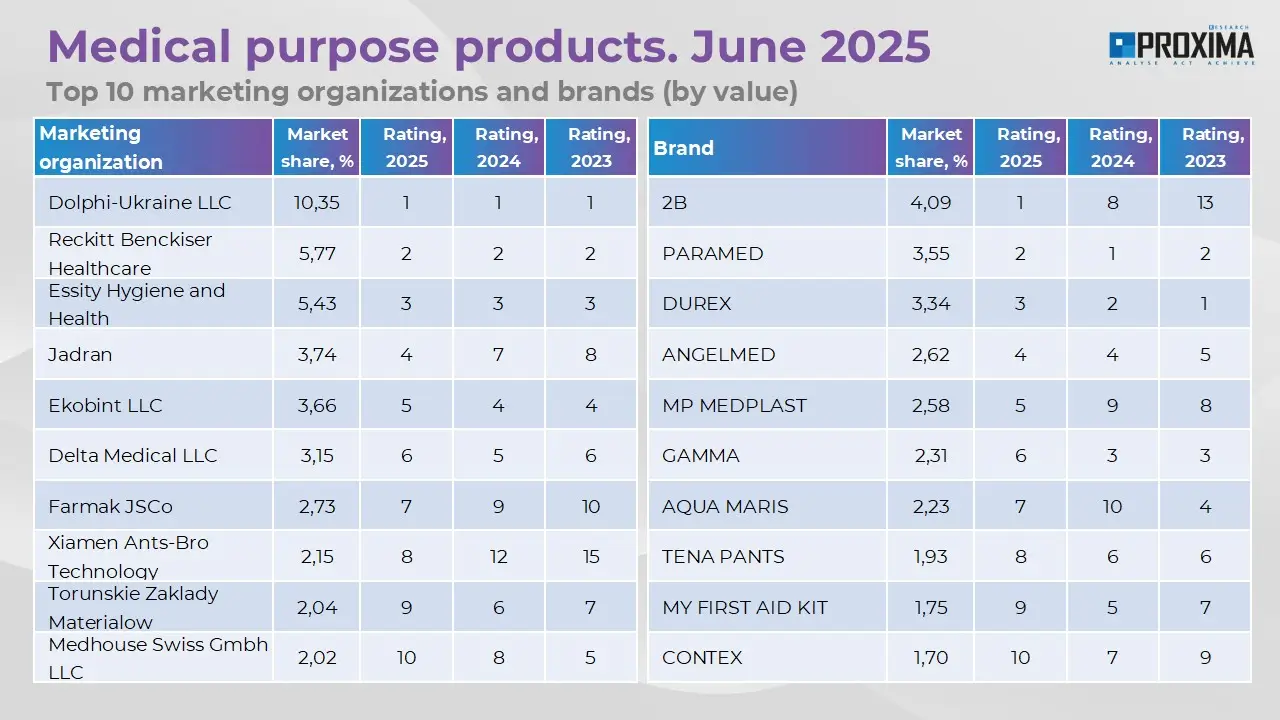
In the medical devices category, the leading positions are held by the companies Dolfi Ukraine, Reckitt Benckiser, and Essity Hygiene and Health, and the brands 2B, Paramed, and Durex (Fig. 12).
Fig. 12.Top 10 marketing organizations by retail sales volume of medical devices and brands in June 2025.
Regional Distribution
Regarding the geographical structure, the largest sales volumes in monetary terms in June 2025 were recorded in Kyiv, Dnipropetrovsk, Kharkiv, and Lviv regions.
Conclusion: The Market is Growing, But Consumers are Cautious
The June figures indicate continued growth of the Ukrainian pharmaceutical market in monetary terms. At the same time, consumption volume in physical units remains almost unchanged, pointing to consumer caution and the growing role of price as a key factor. The main driver of market development remains the inflation-driven increase in the cost of goods, as well as a shift in consumption towards more expensive products.
Among the structural changes, it is worth noting the further strengthening of the role of dietary supplements in monetary terms.
Importantly, not only retrospective but also prognostic tools are playing an increasingly significant role in market assessment. This shift is enabled by the new competitive group forecasting module in the Market Audit system. Thanks to the combination of artificial intelligence and machine learning, companies now have the ability not just to analyze the market by segments, but also to see the likely development dynamics of each individual competitive group for 18 months ahead with high forecasting accuracy. This level of analytics allows for more precise planning of production, marketing activities, and distribution, even in a volatile market environment.
The increasing complexity and accuracy of decision-making tools are stimulating qualitative changes. In conditions of fierce competition and limited purchasing power of the population, it is not only understanding the current situation that becomes key, but also the ability to act proactively. And it is here that new-generation technological solutions provide players with a critical advantage.
Enhance Your Pharmaceutical Business Efficiency with Proxima Research
Evaluate the competitive advantage of updated forecasting today — request a demonstrationof our personalized forecasting service tailored to your competitive groups.
Does the material align with your company's goals?
If the topic caught your interest — feel free to leave a request. Let's discuss how it can work for you.
Thank you!
Thank you for your request! We will contact you shortly.
Close
By clicking the "Submit Request" button, you consent to the processing of your personal data and to receiving electronic communications about Proxima Research products and services. You also agree to our Terms of Use. Your data will be processed in accordance with our Privacy Policy. You may unsubscribe at any time.
By clicking the "Subscribe" button, you consent to the processing of personal data and the receipt of electronic messages about Proxima Research products and services, and you agree to our Terms of Use. Your data will be processed in accordance with our Privacy Policy. You can unsubscribe at any time.
Thank you!
Thank you for your request! We will contact you shortly.