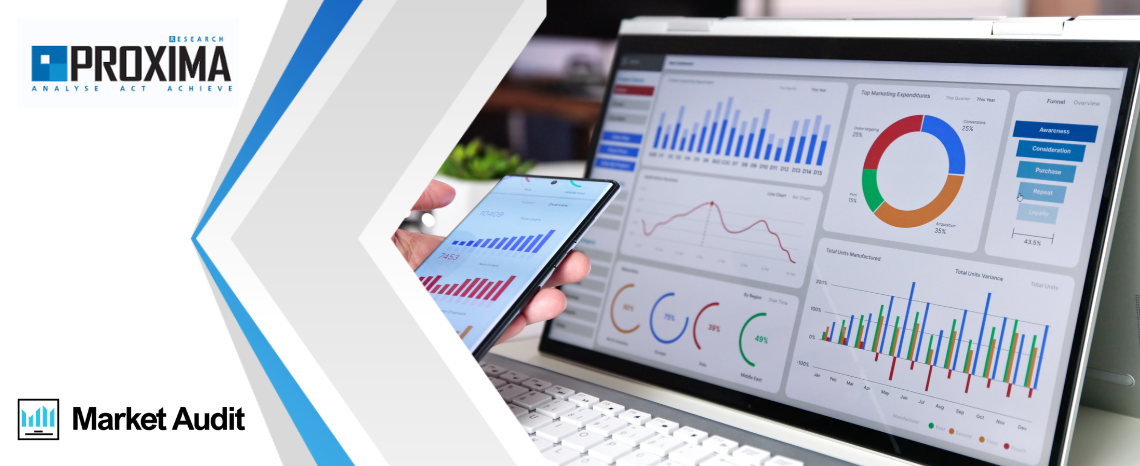
Pharmacy BI
Enhancing pharmacy chain management and market responsiveness with Pharmacy BI analytics tools
Learn more


Advantages of Pharmacy BI reports covering all key business processes

Daily updates

Problem area analysis

All information on your phone

Access anytime, anywhere

Tracking KPI performance compared to local markets

Rapid response to market changes

Time savings for employees
Capabilities of Pharmacy BI
Powerful tools to meet the needs of pharmacy chains in Ukraine
Capabilities of Pharmacy BI
Powerful tools to meet the needs of pharmacy chains in Ukraine

Comparison of pharmacy chains with the market
Reports provide insights into how a pharmacy chain compares to overall market trends.
Learn more
Internal analytics systems for pharmacy chains
In today’s competitive landscape, analytics has become a key tool for managing pharmacy chains.
Learn moreKey aspects
Comparison of pharmacy chains with the market
A critical tool for management, providing key insights for strategic decision-making.
Learn more
Competitor analysis
Market data allows you to clearly understand where your competitors are and how you are positioned. This helps identify growth opportunities and mitigate risks.

Market Trends
Respond promptly to shifts in demand and consumer preferences. Quickly adapt to new trends and industry changes.
Performance Assessment
Comparing market data enables a deep analysis of your network’s efficiency, including sales, profitability, and cost optimization.

Strategic Planning
Utilize market insights to develop growth strategies, including network expansion, product range updates, and new service implementation.

Market Share
This metric is a foundation for planning future growth, allowing you to assess your market presence and expansion potential.

Forecasting
You can accurately predict your network’s development by leveraging market trends and making data-driven decisions.


Services Pharmacy comparison with local markets
Comparing pharmacies with local markets, defined by pharmacy count within a zone or a set radius, ensures highly accurate analytics and recommendations.
Services Pharmacy comparison with local markets
Comparing pharmacies with local markets, defined by pharmacy count within a zone or a set radius, ensures highly accurate analytics and recommendations.

Turnover in the local market
- Sales of the network and individual pharmacies
- Sales in local markets
- Market share calculation and evolution index for each pharmacy and the network as a whole
- KPI comparison with past periods and potential estimation
- Turnover dynamics of the network and pharmacies compared to previous periods
- Network and local market growth trends
- Evolution Index dynamics for the network and each pharmacy

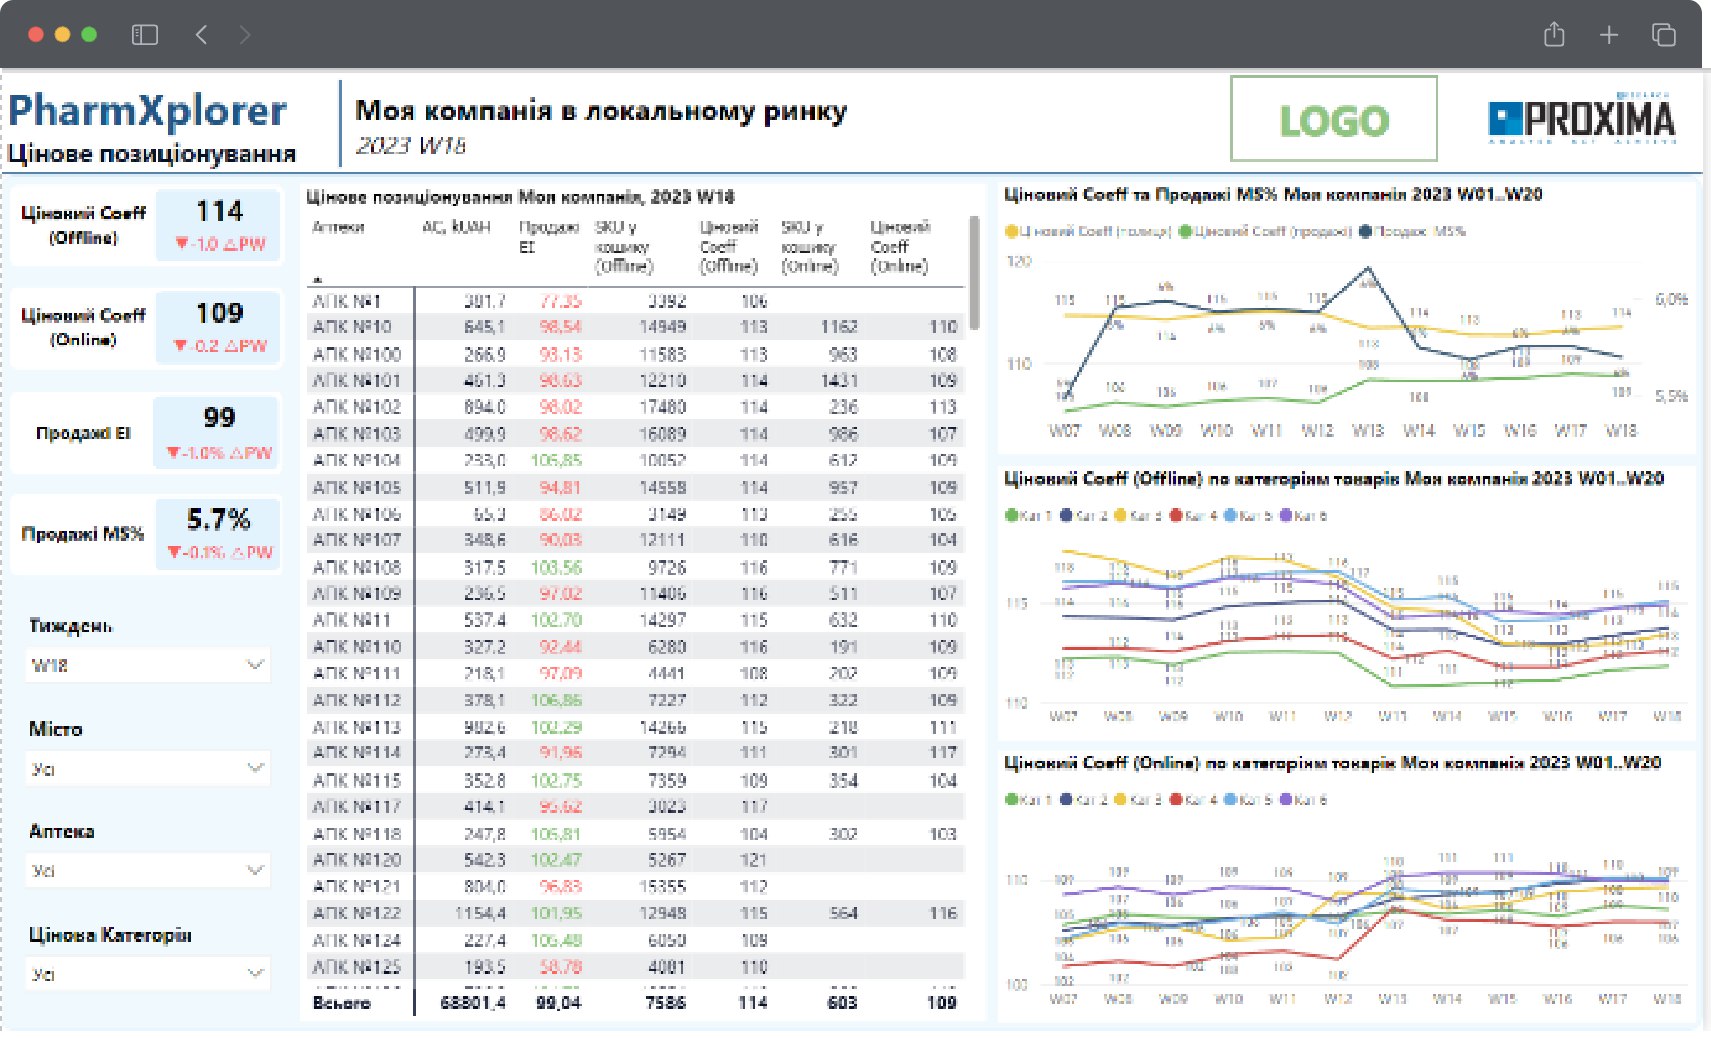
Pricing positioning in the local market
- Defining the consumer “basket” in the local market
- Evaluating a pharmacy’s pricing position in local market sales
- Price assessment of product categories
- Market share and evolution index dynamics and their dependence on pharmacy pricing policy
- Daily or weekly updates
- Ability to efficiently adjust pricing policies based on consumer reactions
- Strategy to not only lower prices but also increase margins without losing market share

Assortment in the local market
- Analysis of pharmacy and local market sales and stock levels
- Assessment of demand coverage by product offerings in each local market
- KPI calculations for assortment efficiency to make informed changes to the product matrix
- Potential to increase pharmacy turnover through effective assortment expansion
Internal analytics aystems for pharmacy chains
In today’s competitive environment, analytics is a key tool for managing pharmacy chains. With our system, you get:
Request a consultation
Assortment optimization
Sales analysis helps focus on the most popular products, increasing turnover and profitability.

Inventory management
Demand forecasting prevents stock surplus or shortages, significantly reducing costs.

Customer behavior analysis
Purchase data allows for personalized offers, improving customer loyalty and retention.

Pricing & promotions
Analytics help determine optimal pricing and promotional timing to boost sales volume.

Operational efficiency
Identify process bottlenecks and significantly improve staff and operational productivity.

Market trends
Our reports help you quickly react to new trends, securing a competitive advantage.

Personalized marketing
Create tailored offers for different customer segments, increasing conversion rates and satisfaction.

Pharmacy performance assessment
Identify the productivity of individual pharmacies to optimize the entire network’s operations.

Trend forecasting
Use historical data and current trends to predict future performance, staying ahead of competitors.
Examples of internal analytics reports for pharmacy chains
Advantages of our solution
This solution will enable your pharmacy chain to compete effectively while staying ahead.

Automated data transfer via API – fast and reliable

Processing of billions of data rows

Use of international visualization standards

There is no need to build a DWH on the client’s side, hire additional developers, or deploy additional platforms
Explore more


Subscribe
for news of our products
By clicking the "Subscribe" button, you consent to the processing of personal data and the receipt of electronic messages about Proxima Research products and services, and you agree to our Terms of Use. Your data will be processed in accordance with our Privacy Policy. You can unsubscribe at any time.
or
-
 Market Audit
 Axioma
 Pharmacy Stock
 Proxima Cloud CRM
 Proxima OCM
 GeoForce
 Photo Recognition
 BI+Distributors Reports
-
 Proxima CLM
 Proxima Apteka
 DB Drugs
 PromoTest
 Proxima CRM
 RXTest